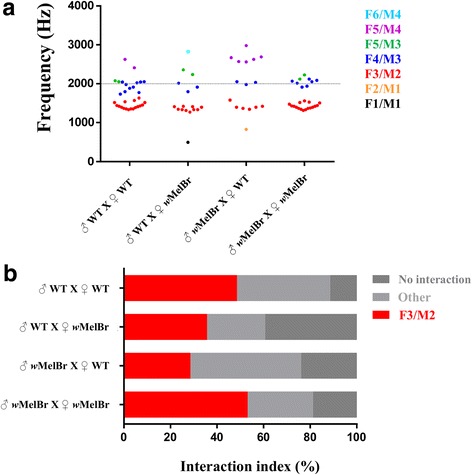
Fig. 3.

Harmonic convergence of wMelBr and WT couples. a Distribution of converging samples per couple type. Converging samples were classified by color according to the harmonic frequencies involved in the acoustic interaction, where F/M represent female and male components. The dotted line at 2000 Hz depicts Ae. aegypti putative hearing threshold. b Relative contribution of F3/M2, alternative (other) and ‘no interaction’ samples
