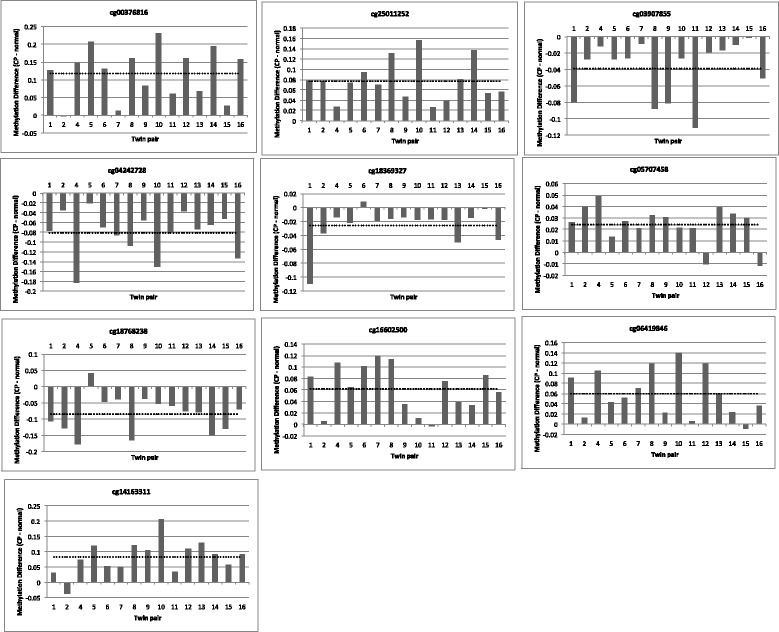
Fig. 1.

DNA methylation differences (CP minus normal twin) for the top ten CP-specific DMPs. The direction of methylation difference for each probe was consistently in the same direction (hyper- or hypomethylated) across > 12/15 twin pairs. The dotted line represents the average methylation difference, and methylation difference is represented in absolute value (effect size of 0.1 is 10% methylation difference)
