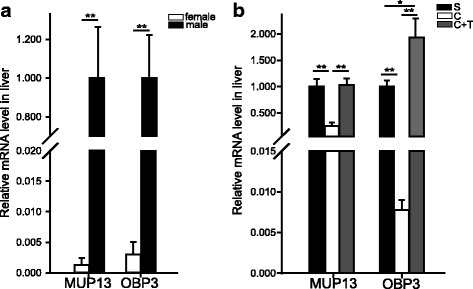
Fig. 4.

Comparison of the hepatic expression of the Mup13 and Obp3 mRNAs between the two sexes and among the three groups in the castration experiments. a Differences in Mup13 and Obp3 expression in female and male rats (mean ± SE, n = 5 for each sex, **P < 0.01, independent-sample t-test). b Expression patterns of Mup13 and Obp3 among groups in the castration experiment (mean ± SE, n = 5 for each group, *P < 0.05, ** P < 0.01, one-Way ANOVA followed by Tukey’s post hoc HSD test) (S: sham-operated, C: castrated, C + T: castrated + T-treated)
