
Fig. 8.
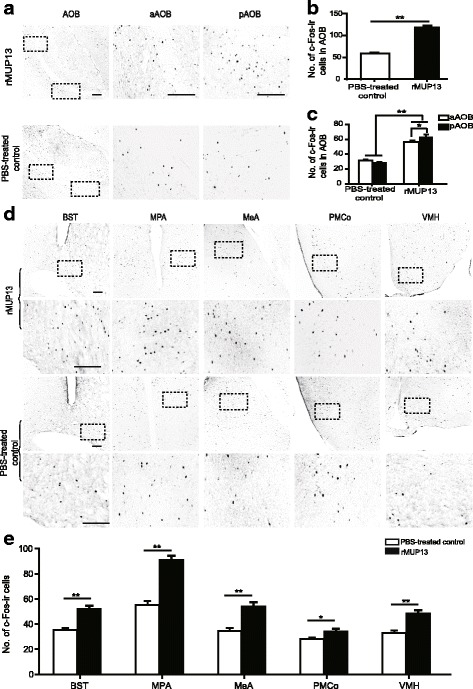
Increased c-Fos expression in females after sniffing rMUP13. Expression of c-Fos in the AOB (a) and five different higher brain centres (d); relative statistical analyses of the data presented in (b), (c) and (e) (n = 6, mean ± SE, **P < 0.01, *P < 0.05, independent-sample t-test for brain areas, aAOB, pAOB and AOB in PBS-treated control and treated groups, paired t-test or Wilcoxon signed-rank test for aAOB and pAOB from the PBS-treated control and treated groups. Scale bars = 25 μm)