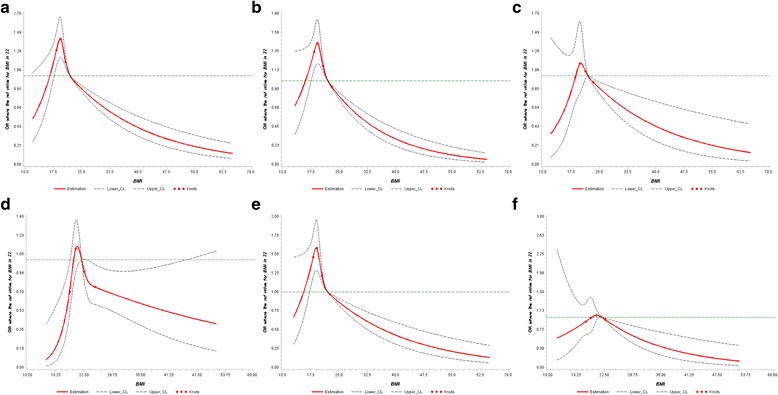
Fig. 1.

Adjusted dose-response association between BMI and risk of lung cancer: (a) All participants (b) Men (c) Women (d) Former smokers (e) Current smokers (f) Never smokers. BMI was coded using an RCS function with four knots arbitrarily located at the 5th, 10th, 20th and 40th percentiles. The y-axis represents the adjusted odds ratio for lung cancer risk for any value of BMI compared to individuals with a BMI of 22.0 kg/m2 (median value of BMI). Dashed lines are 95% CI. Knots are represented by dots
