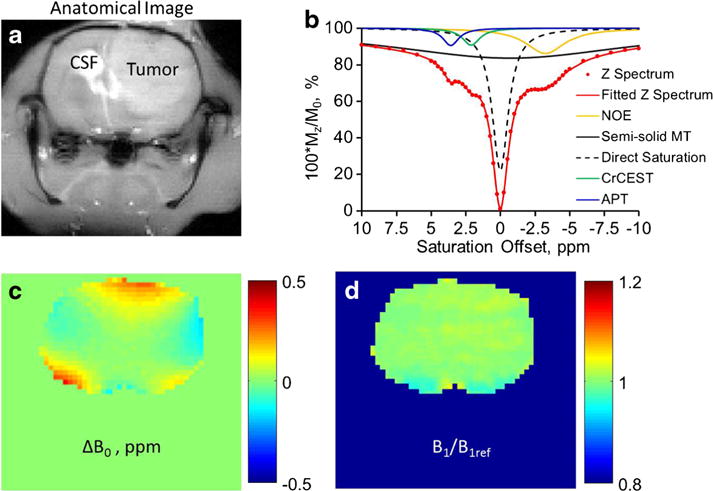
Fig. 1.

a Anatomical tumor-bearing images of the rat brain acquired at −2 ppm pre-saturation with tumor and cerebrospinal fluid (CSF) regions indicated. b Demonstration of the multicomponent fitting of an experimental tumor Z-spectrum for the separated quantification of NOE, semi-solid MTC, direct saturation, CrCEST, and APT. c B0 map of the brain. d B1 map or B1 to reference B1 ratio (B1/B1ref) map of the brain.
