
Fig. 2.
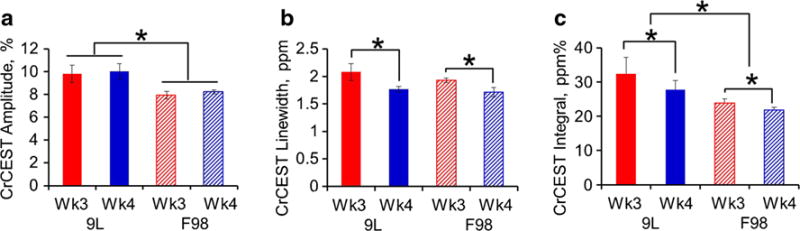
The a amplitude, b linewidth, and c integral of the fitted CrCEST peak from 9L and F98 gliomas at weeks 3 (n = 5) and 4 (n = 4) post-tumor implantation. *p < 0.05.
Official websites use .gov
A
.gov website belongs to an official
government organization in the United States.
Secure .gov websites use HTTPS
A lock (
) or https:// means you've safely
connected to the .gov website. Share sensitive
information only on official, secure websites.
The a amplitude, b linewidth, and c integral of the fitted CrCEST peak from 9L and F98 gliomas at weeks 3 (n = 5) and 4 (n = 4) post-tumor implantation. *p < 0.05.