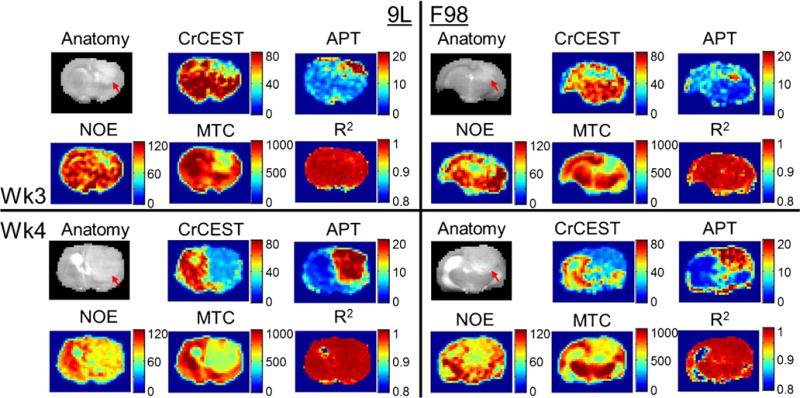
Fig. 4.

Anatomical tumor-bearing images of the brain acquired with saturation at −2 ppm (gray scaled, red arrows indicate tumors), the corresponding CrCEST, APT, NOE, and MTC integral maps (false colored), and fitting R2 maps from 9L (left panels) and F98 (right panels) brain tumors at the third (top panels) or fourth (bottom panels) week post-tumor implantation.
