. 2018 Jan 4;10(2):309–322. doi: 10.1039/c7mt00324b

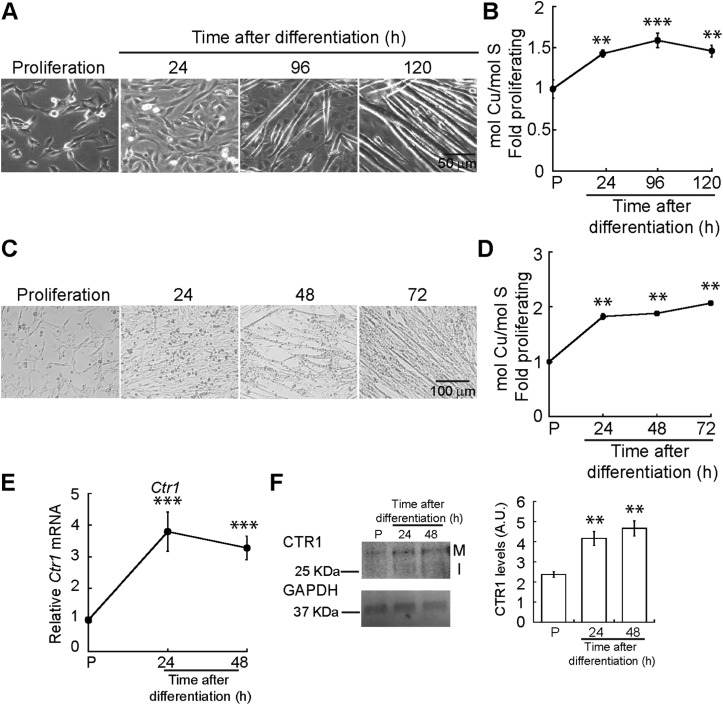
Fig. 1. Cytosolic Cu increases during myogenic differentiation. (A) Representative light micrographs of proliferating and differentiating C2C12 myoblasts. (B) Whole cell Cu content of differentiating C2C12 myoblasts was determined by ICP-OES and reported as fold change relative to proliferating (P) cells. Data is represented as the average Cu concentration of three independent biological replicates ± standard error of the mean (SE). (C) Representative light microscopy images of proliferating and differentiating primary myoblasts derived from murine satellite cells. (D) Whole cell Cu content of differentiating primary myoblasts was determined by ICP-OES and reported as fold change relative to proliferating (P) cells. (E) Steady-state Ctr1 mRNA levels in proliferating and differentiating primary myoblasts as determined by qRT-PCR. (F) CTR1 levels [primary translation product (I) and the mature glycosylated forms (M)] shown by representative Western blot and densitometric quantification of CTR1 bands in proliferating (P) and differentiating primary myoblasts of CTR1 in proliferating and differentiating primary myoblasts. GAPDH was used as loading control. Data are represented as the average Cu concentration of three independent biological replicates ±SE. **P < 0.01; ***P < 0.001.

Fig. 1