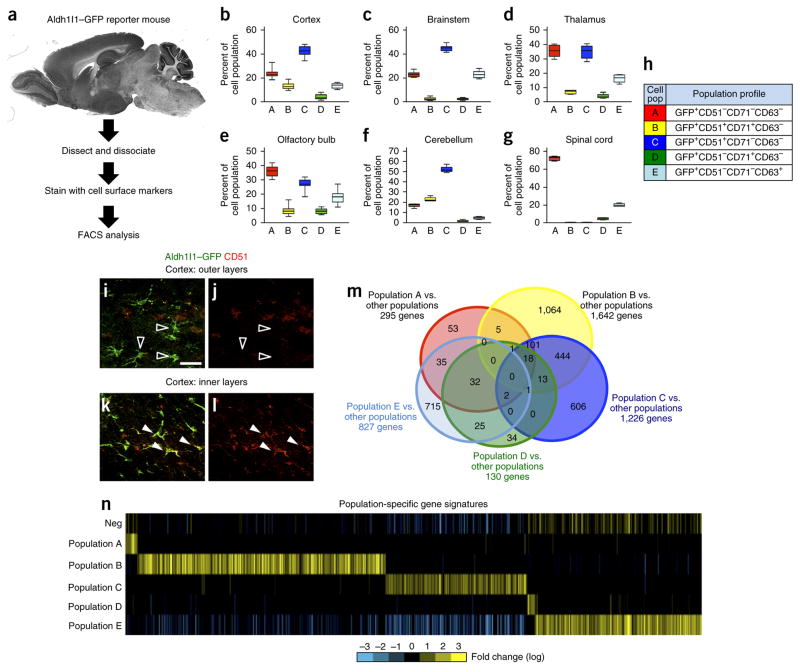
Figure 1.
Prospective isolation of Aldh1l1–GFP astrocyte subpopulations. (a) Schematic of the intersectional approach used to identify astrocyte subpopulations in the adult brain. (b–g) FACS analysis for each subpopulation that was identified across the cortex (b), brainstem (c), thalamus (d), OB (e), cerebellum (f) and spinal cord (g) through the combinatorial use of anti-CD51, anti-CD63 and anti-CD71. Data are mean ± s.e.m., represented as box and whisker plots (25th–75th percentiles (boxes), 10th–90th percentile (whiskers) and median (horizontal lines)) and derived from eight independent FACS experiments; for each experiment, brain regions from n = 4 mice were pooled and analyzed. Please see Supplementary Figure 3 for associated statistical analysis. (h) Code relating population nomenclature (A–E) to cell surface marker combination. (i–l) Representative images for Aldh1l1–GFP expression (i,k) and immunostaining for CD51 expression (j,l) in the outer (n = 3) (i,j) and inner (n = 3) (k,l) cortical layers in the brains of Aldh1l1–GFP mice. Unfilled arrowheads demonstrate non-overlapping GFP and CD51 expression, and filled arrowheads represent cells with overlapping expression. Please see Supplementary Figure 4 for additional CD71 immunostaining in the cortex. Scale bar, 20 μm. (m) Venn diagram depicting the absolute number of genes whose expression is enriched in each prospective population and their relative overlap with the genes in other populations using the ‘Y ~population + region’ linear model (FDR < 10%). Due to dimensional constraints, only 21 of the possible 31 intersections are depicted (complete quantification of all 31intersection points in Supplementary Table 3). (n) Heat map depicting the expression of gene sets identified for each subpopulation using the ‘Y ~population + region’ linear model (FDR < 10%). “Neg” represents the Aldh1l1–GFP-negative population. Bright yellow and blue represent threefold differences from the median across populations.

