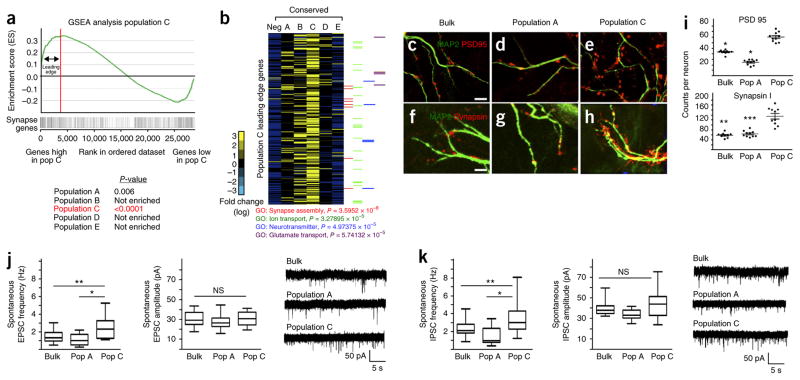
Figure 3.
Astrocyte populations differentially support synaptogenesis. (a) GSEA plot, comparing genes whose expression is enriched in population (Pop) C to an established set of genes associated with synapse formation and function. P values (by GSEA method, with 1,000 gene-set permutations) evaluate enrichment of synapse gene expression within each respective population. Red line and associated arrows depict the ‘leading edge’, which can be interpreted as the core set of genes that accounts for the enrichment signal. (b) Heat map analysis for expression of population C leading-edge genes (270 genes represented) across all astrocyte populations. Note that ‘neg’ represents the Aldh1l1–GFP-negative control population; the experiment was done once, and its bioinformatics were compared between populations and synaptic genes. P values were derived using the Fisher exact test. (c–i) Representative images for expression of synaptic markers PSD95 (c–e) and synapsin (f–h), as well as their quantification (i) after co-culture of bulk astrocytes (c,f,i), population A cells (d,g,i) or population C cells (e,h,i), with neurons (marked by MAP2). Data are mean ± s.e.m. Quantification is from three independent cell cultures (neurons from three different mice and astrocytes derived from three independent FACS experiment). A total of ten neurons were each quantified for both PSD95 and synapsin expression. *P < 10−7, **P = 2.72 × 10⁻⁸ and ***P = 2.3 × 10⁻⁸; F2,29 =142 (PSD95) and F2,29 = 37.79 (synapsin). P-values derived using one-way ANOVA. Scale bars, 5 μm. Scale bars in c also apply to d and e; scale bars in f also apply to g and h. (j,k) Whole-cell recordings from neurons; frequency (left) and amplitude (middle) of sEPSC (bulk, n = 20 neurons; population A, n = 23 neurons; population C, n = 18 neurons) (j) and sIPSC (bulk, n = 21 neurons; population A, n = 23 neurons; population C, n = 21 neurons) (k), and the associated traces (right), are shown. The recording was done from three independent cell cultures (neurons from three mice and astrocytes derived from three independent FACS experiments). Data are mean ± s.e.m.; data are represented as box and whisker plots (25th–75th percentiles (boxes), 10th–90th percentiles (whiskers) and medians (horizontal lines)). *P < 0.01 (P = 0.0051 (j) or P = 0.0056 (k), *P = 1.8 × 10⁻⁵, **P < 1.26 × 10⁻⁶ and NS, not significant; F2,60=12.57 (j) or F2,63=16.03 (k); by one-way ANOVA followed by Tukey’s test for between-group comparisons.

