Figure 5.
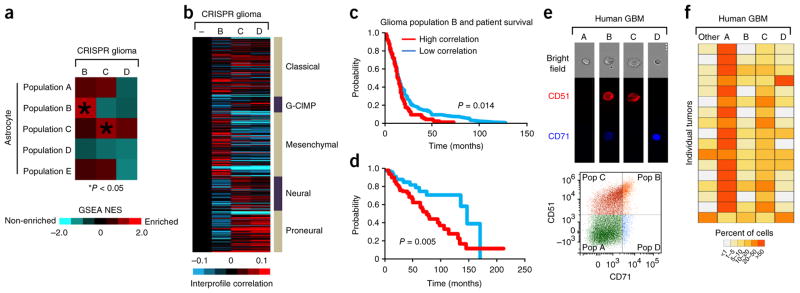
Glioma subpopulations are present in human glioma. (a) GSEA results comparing each indicated glioma-population-specific gene set (Supplementary Table 10) with global gene rankings according to indicated astrocyte population comparisons. NES, GSEA normalized enrichment score scale is shown in color bar. Red denotes enrichment of glioma gene set within the astrocyte population profile. (b) Heat map showing intersample Pearson’s correlations (red, positive; bright red or blue denotes r-value > 0.1 or < −0.1, respectively, across ~7,000 genes) between mRNA profiles of mouse glioma populations (columns; genes first centered on control group) and mRNA profiles of human glioblastoma (rows; from TCGA, n = 528 cases). Minus sign represents the Aldh1l1–GFP-negative control population. (c,d) Differences in overall survival for patients with glioblastoma (n = 523 cases in total) (c) and for patients with lower-grade glioma (n = 515 cases) (d) that is associated with global correlation with population B. Red, brain cancer cases in top one-third of correlations (n = 175 (c); n = 172 (d)); blue, cases in bottom one-third of correlations. Log-rank p-value comparing the top one-third cases with the bottom one-third cases is 0.014 (c) and 0.005 (d). In c, chi square = 6.09515907; in d, chi square = 7.75721882233268. (e) Representative FACS analysis of primary human malignant glioma and the associated plot (n = 5). (f) Heat map analysis showing the constitution of the subpopulations (A–D and ‘other’) in primary human glioma across 17 samples. The ‘other’ population is comprised of CD133+ and CD31+ subpopulations.

