Figure 7.
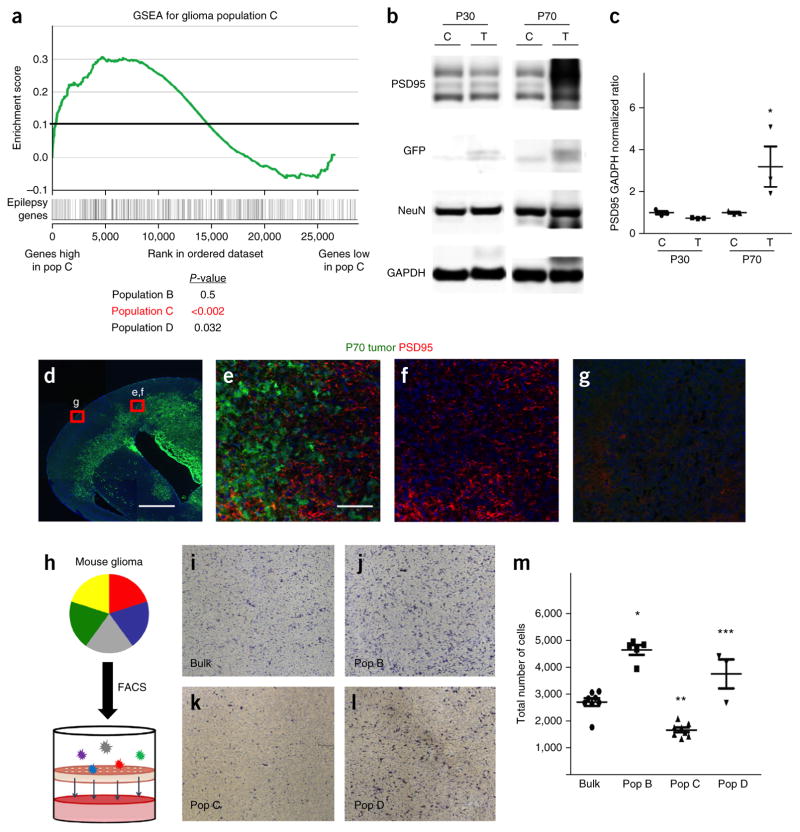
Glioma subpopulations show functional diversity. (a) GSEA plot comparing the molecular signature of glioma population C (versus negative control) to an established cohort of genes associated with epilepsy. P-values (by GSEA method, with 1,000 gene-set permutations) evaluate enrichment of epilepsy-associated genes within each respective population. (b,c) Representative immunoblot for PSD95 expression in tumor (T) and control (C) cortex from mice at P30 and P70 (b), and quantification from three independent immunoblots from three independent tumors for each time point (c). *P = 0.054 by independent t-test to analyze the difference between control and tumor group. NeuN is included to normalize for neuronal numbers and GAPDH is the loading control. (d–g) Representative low-magnification (d) and high-magnification (e–g) images of PSD95 staining (red) in a brain tumor (green; GFP+) at P70 (from n = 3 for each). Red boxes in d indicate tumor-adjacent and tumor-distal areas that are magnified in e–g. Scale bars, 1,000 μm (d) and 100 μm (e–g). (h) Schematic showing the combined FACS and Transwell invasion assay. (i–m) Representative images showing cells that have migrated through the Transwell onto the chamber for bulk glioma astrocytes (i) or for FACS-isolated glioma populations B (j), C (k), D (l) and their quantification derived from three independent experiments using three independently derived tumors (m). Images in i–l are from a 96-well plate ChemoTx Chemotaxis System (106-8, NeuroProbe). *P = 1.49 × 10⁻⁶, **P = 9.23 × 10⁻⁴ and ***P = 0.0128; F2,11 = 10.62; by one-way ANOVA followed by Tukey’s test for between-group comparisons. Throughout, data are mean ± s.e.m. For the purpose of presentation, the blot images were cropped from the original images. Full-length blots can be found in Supplemental Figure 6.

