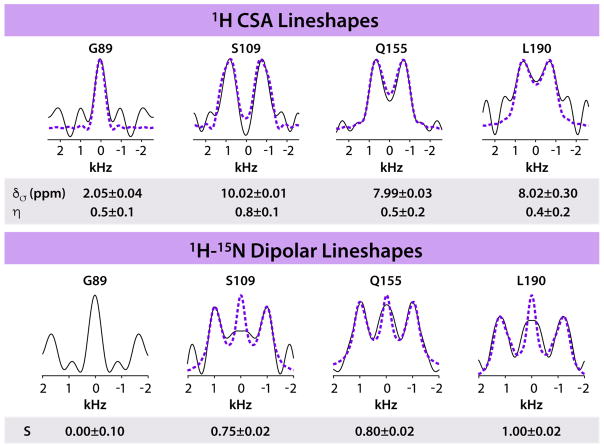
Figure 4.
Representative 1H CSA (top) and 1H-15N dipolar (bottom) lineshapes for G89, S109, Q155, and L190 in tubular assemblies of HIV-1 CA protein, extracted from RN-symmetry based 3D experiments. The spectra were recorded at 19.96 T (850 MHz) using a 0.7 mm probe, and a MAS frequency of 110 kHz. Features outside of ±1.5 kHz range are spectral noise.

