
Fig. 1. Recurrent ST infection diminishes the abundance and protective role of IAP.
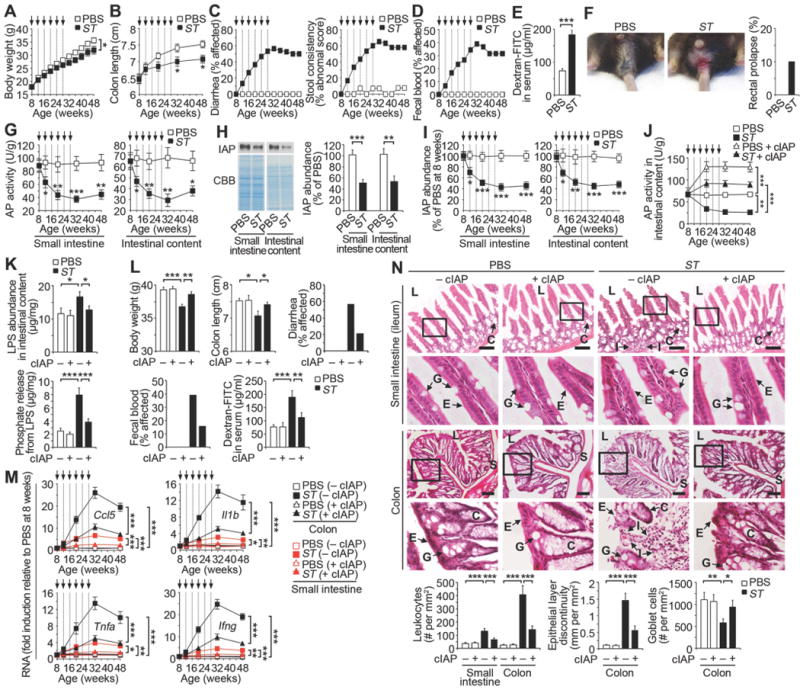
Wild-type mice were analyzed during a course of recurrent ST infection (2 × 10³ cfu) or uninfected (PBS) at indicated time points (arrows). (A) Body weight (ST, n = 20; PBS, n = 19). (B) Colon length (n = 40 per condition). (C) Diarrhea and stool consistency (ST, n = 19; PBS, n = 13). (D) Fecal blood (ST, n = 19; PBS, n = 13). (E) Intestinal epithelial barrier function (n = 8 per condition) at 20 weeks of age prior to the fourth infection. (F) Rectal prolapse (ST, n = 30; PBS, n = 20) at 32–48 weeks of age, or 4–20 weeks following last ST infection (representative image). (G) AP activity (n = 40 per condition). (H) Immunoblot blot analysis of IAP at 20 weeks of age prior to the fourth infection (n = 8 per condition). (I) Relative IAP abundance (n = 40 per condition). (J) AP activity +/− calf IAP (cIAP) (n = 40 per condition). (K) LPS abundance and phosphate released from LPS (n = 8 per condition) at 20 weeks of age. (L) Body weight (n = 10 per condition), colon length (n = 8 per condition), diarrhea (ST, n = 23; PBS, n = 14; ST + cIAP, n = 19; PBS + cIAP, n = 15), fecal blood (ST, n = 23; PBS, n = 14; ST + cIAP, n = 19; PBS + cIAP, n = 15) at 48 weeks of age (20 weeks following last ST infection), and intestinal epithelial barrier function (n = 8 per condition) at 20 weeks of age prior to the fourth infection. (M) Cytokine mRNA expression (n = 30 per condition). (N) H & E-stained intestinal tissues at 48 weeks of age (20 weeks following last ST infection). L, intestinal lumen; E, epithelial layer; C, crypt; G, goblet cell; S, submucosa; I, infiltration of leukocytes. Graphs are representative of 16 fields of view (4 mice per condition). All scale bars: 100 µm. Error bars, means ± SEM. ***P < 0.001; **P < 0.01; *P < 0.05; Student’s t test (A), (B), (E), (G), (H), and (I) or one-way ANOVA with Tukey’s multiple comparisons test (J) to (N).