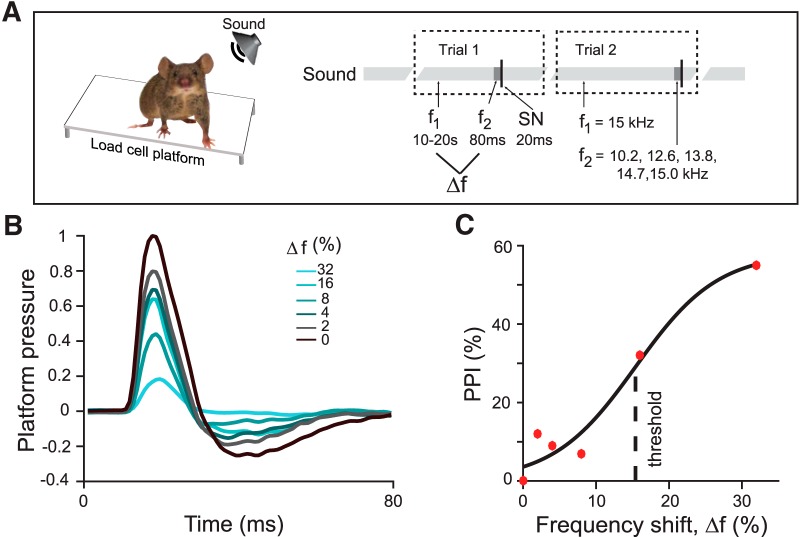
Figure 1.
Measurement of behavioral frequency discrimination acuity. A, Schematic of measurement of frequency discrimination acuity in mouse. Left, Startle response measured as pressure the subject exerts on a platform. Right, Sound stimulus time course: an ongoing background tone (light gray, f1) is followed by a brief prepulse tone of different frequency (dark gray band, f2) and then by a startle noise (thin black band, SN). B, Normalized time course of platform pressure during the startle response to noise for different prepulse tones for an exemplar mouse. Time relative to SN onset. C, PPI measured as reduction in the acoustic startle response as a function of the frequency shift (Δf) between the background and prepulse tones (see Materials and Methods, Eq. 1) of an exemplar mouse. PPI does not reach 100% because, even with an easily identifiable prepulse tones, the animal still startles. Dots, Data; solid line, fit.

