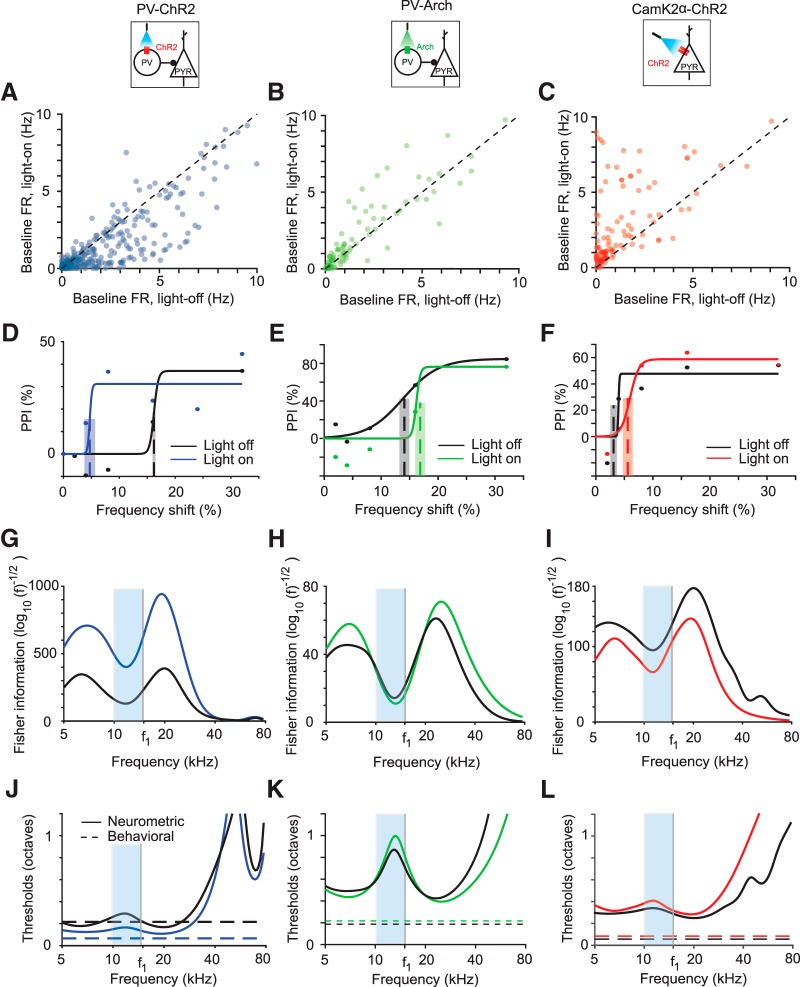
Figure 3.
Optogenetic manipulation of PV activity shifts behavioral and neurometric frequency discrimination thresholds in individual subjects. A–C, Baseline firing rate of light-on versus light-off trials for all frequency-tuned neurons pooled across subjects in PV-ChR2 (blue), PV-Arch (green), and CamK2a-ChR2 (red) mice, respectively. D–F, PPI as a function of tone frequency shift for exemplar mice. Best estimated thresholds (dashed lines) and uncertainties (overlaid gray rectangle) are plotted for reference. Black, Light-off trials; blue, green, red, light-on trials. Dots, Data; solid lines, best fit curve. G–I, Fisher information computed using tuning curves using neurons recorded from mice in D–F. Frequencies used are indicated by the blue region. J–L, Neurometric threshold estimate as inverse square root of Fisher information (solid) and behavioral threshold at f1 (horizontal dotted) for the same mice as D–F. Light blue bands indicate the region in frequency space from which behavioral measurements were taken.

