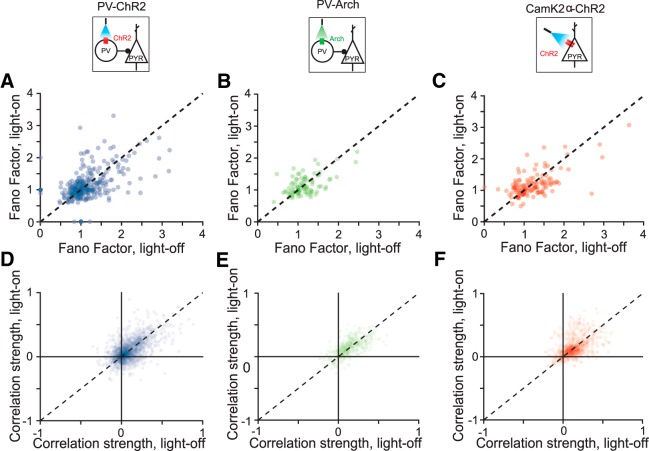
Figure 7.
Fano factor and correlation scatter plots comparing light-on and light-off conditions. A–C, Fano factor with and without light on for PV-ChR2, PV-Arch, and Pyr-ChR2 mice, respectively. D–F, Pairwise correlations with and without light on for PV-ChR2, PV-Arch, and Pyr-ChR2 mice, respectively.

