Figure 2:
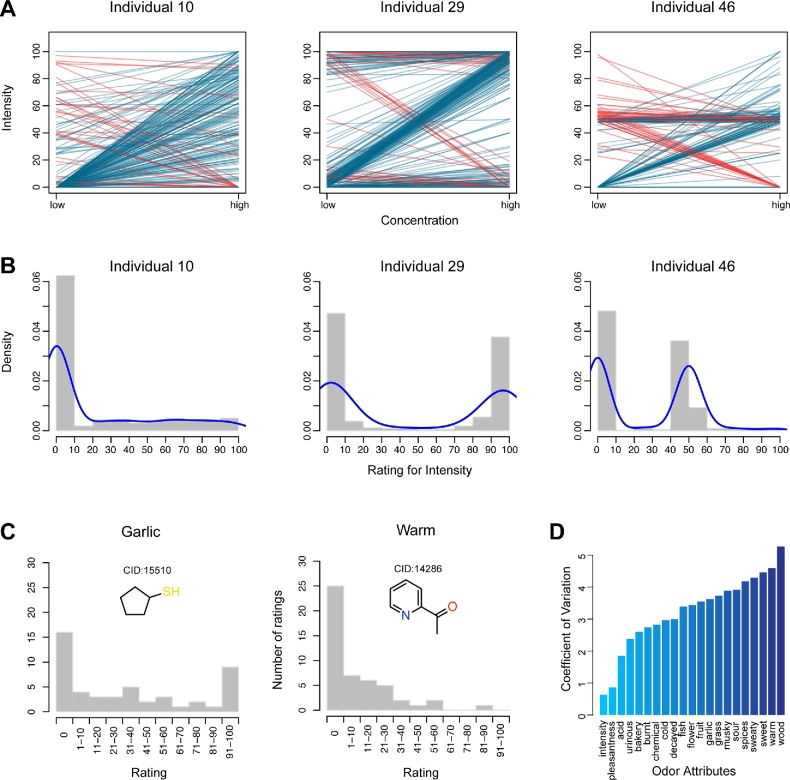
Variability of olfactory perception among individuals. (A) The intensity ratings for all molecules at low and high concentrations from individuals 10, 29, and 46. Blue lines represent the ideal cases, in which the rating values increase as the concentration becomes higher. Conversely, red lines represent decreased rating values at high concentration. (B) The density distributions of the intensity ratings from these 3 individuals. Blue lines are the fitting curves of the density distribution. The intensity ratings and density distributions from all individuals are shown in Supplementary Figs S1 and S2, respectively. (C) The “garlic” and “warm” rating distributions among 49 individuals for 2-acetylpyridine and cyclopentanethiol, respectively. D) The coefficients of variation of 21 perceptual attributes in increasing order.

