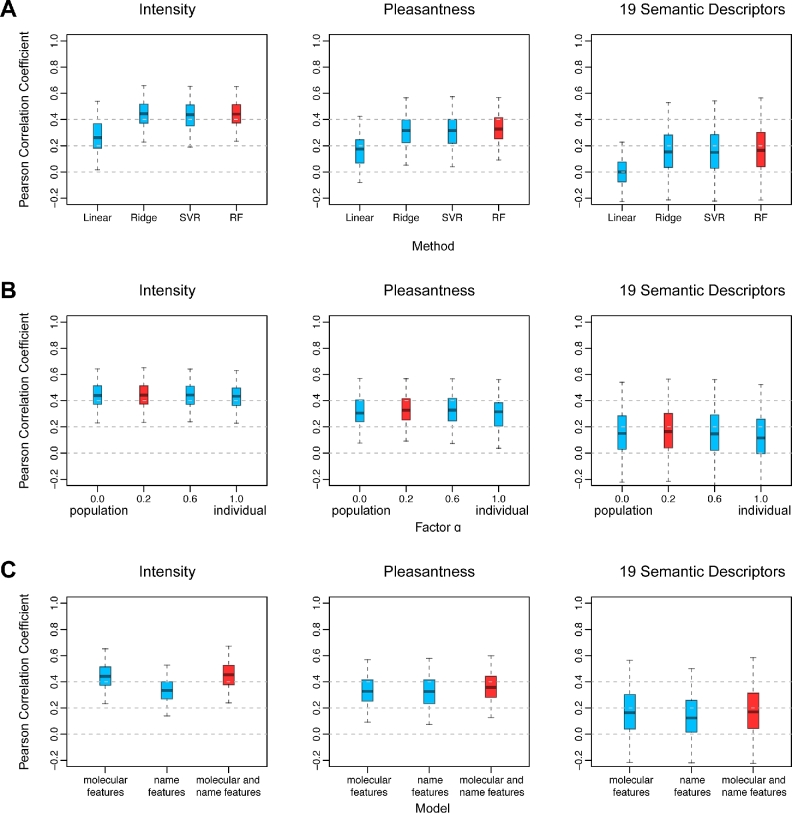
Figure 3:
The performance of different models and strategies. From left to right, the Pearson's correlation coefficients of intensity and pleasantness and 19 semantic descriptors from 5-fold cross-validations are shown as a boxplot. The red base-learners or strategies are used in our final model. (A) The performance of 4 different base-learners: linear, ridge, SVM, and random forest. (B) The performance of using different values of weighting factor α. (C) The performance of using molecular features alone, name features alone, and both molecular and name features.

