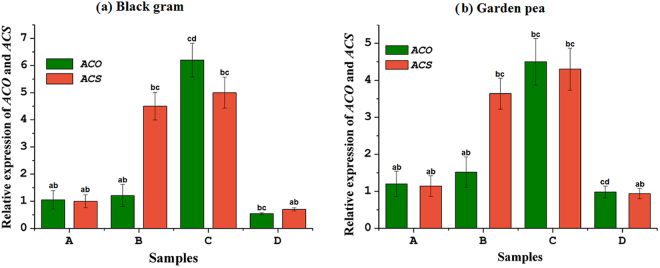
Figure 5.
Relative gene expression level of ACO and ACS in leaf tissue of (a) black gram and (b) garden pea plants in different treatment conditions. Treatments: A- uninoculated watered plants as positive control, B-consortium (Ochrobactrum pseudogrignonense RJ12 + Bacillus subtilis RJ46 + Pseudomonas sp.RJ15) inoculated plants with drought stress induction, C- uninoculated plants under drought stress as negative control, D-consortium (Ochrobactrum pseudogrignonense RJ12 + Bacillus subtilis RJ46 + Pseudomonas sp.RJ15) inoculated with sufficient water supply. Two-way ANOVA was performed considering water supply and bacteria inoculation as two independent variables followed by Tukey’s post-test for each treatment. Different symbols on bars indicates a significant difference at p = 0.05 in gene expression under different treatment condition.

