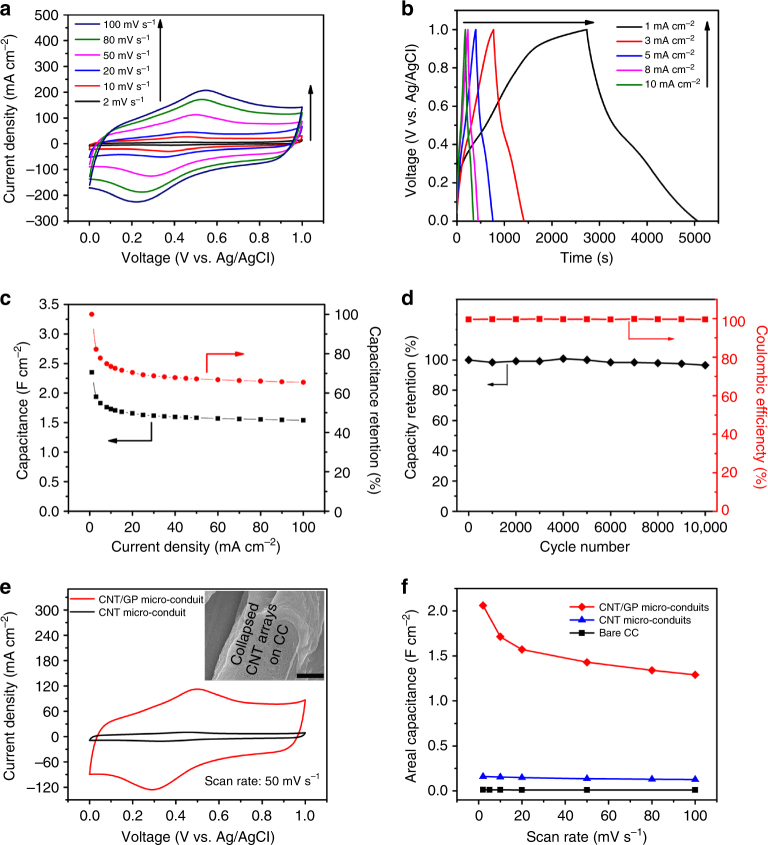
Fig. 2.
Electrochemical characterization of CNT/GP micro-conduits. a CV curves of a typical CNT/GP micro-conduit electrode (GP growth time of 18 min) in a three-electrode configuration with 1 M H2SO4 aqueous solution at scan rates from 2 to 100 mV s−1. b Galvanostatic charge/discharge profiles of the CNT/GP micro-conduit electrode at current densities from 1 to 10 mA cm−2. c Specific capacitances and capacitance retention as functions of current densities of the CNT/GP micro-conduit electrode. d Charge/discharge cyclic stability at a current density of 60 mA cm−2 and coulombic efficiencies during the test. e Comparative CV curves of typical CNT micro-conduit and CNT/GP micro-conduit electrodes at a scan rate of 50 mV s–1. The inset (Scale bar: 5 μm) shows that the bare CNT micro-conduit structure collapses and forms a matt-like structure on the CC micro-fiber. f Comparison of areal specific capacitances of bare CC, CNT micro-conduit, and CNT/GP micro-conduit electrodes at different scan rates from 2 to 100 mV s−1

