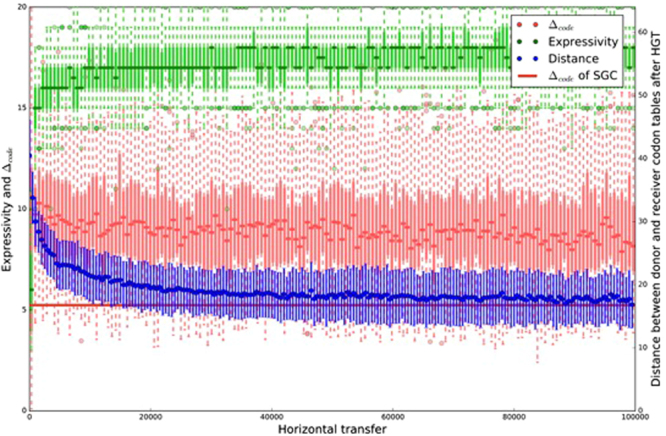
Figure 4.

Emergence of artificial genetic codes. Results are averaged from 50 runs and plotted in intervals of 500 transfers. Expressivity counts the receiver’s encoded amino acids after a transfer (range [1, 20]), plotted as a box plot where the dark green bar represents the overall mean, the lighter green bar represents lower and upper quartiles, dotted lines represent minimum and maximum non-outliers, and circles represent outliers. Δcode represents optimality as the code’s robustness to single nucleotide changes (red box plot). The standard genetic code (SGC) has an expressivity of 20, the number of amino acids encoded in the code. The Δcode of SGC’s codons (excluding stop codons) is 5.24 (red line). The most robust artificial code with the same expressivity as the SGC has a Δcode of 4.17 (see Fig. 1b for details). Universality is measured as the average distance between all codes in a group of protocells, where distance is calculated as the number of different codon assignments (range [0, 64]). We plot the overall mean distance and its standard deviation, with the final average of 16.86 different assignments being the smallest overall average encountered for the duration of these runs.
