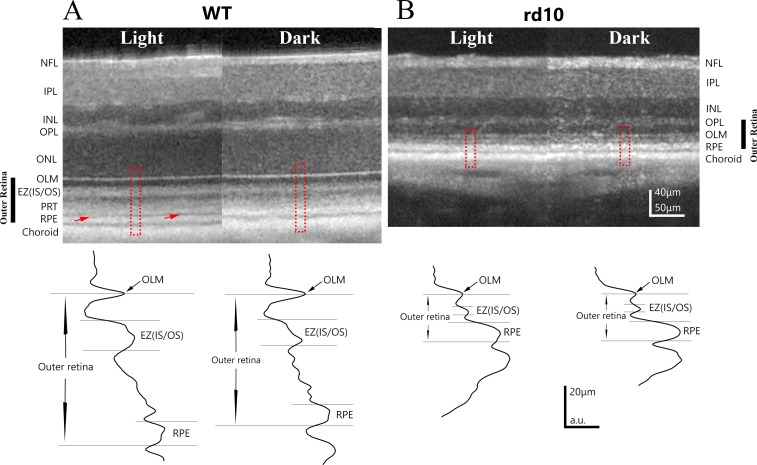
Figure 1.
Examples of OCT images obtained from light- and dark-adapted WT and stage I rd10 mice. (A) Representative example of OCT retinal images obtained from the same eye of a P40 WT mouse under light-adapted and dark-adapted conditions. Red arrows point to a hyporeflective layer between PRT layer and RPE layers, which is present under light-adapted conditions but absent in dark-adapted conditions. Intensity profiles for outer retina region (outlined by red dash line box) are shown in the bottom panel. (B) Representative example of OCT retinal images obtained from the same eye of a P26 rd10 mouse under light-adapted and dark-adapted conditions. Light-induced OCT response is much smaller in this stage I rd10 mouse. Bottom panel illustrates intensity profile of OCT intensity in outer retina from outlined regions. NFL, nerve fiber layer; IPL, inner plexiform layer; INL, inner nuclear layer; OPL, outer plexiform layer; ONL, outer nuclear layer.

