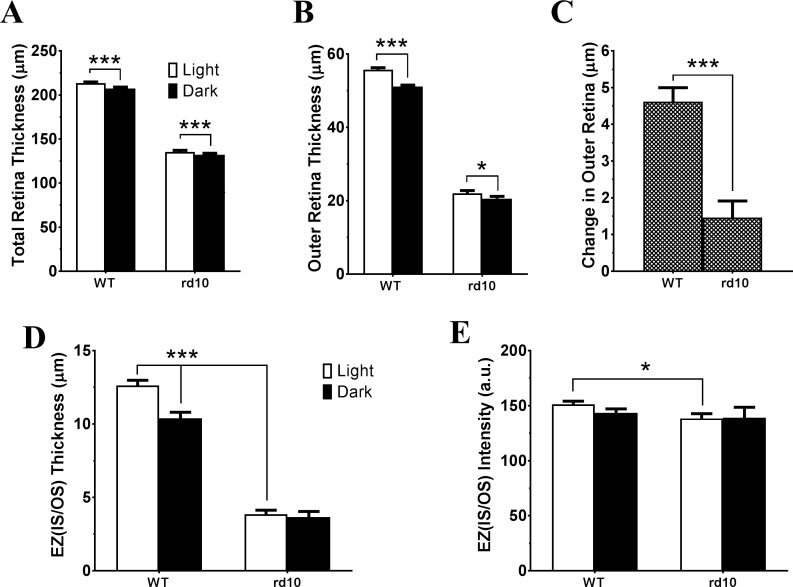
Figure 2.
Light-induced OCT responses in WT and stage I rd10 mice. Bar graphs summarized measurements from OCT images acquired under light- and dark-adapted conditions of WT and rd10 eyes for averaged total retinal thickness (A), outer retinal thickness (B), light-adaptation induced OCT responses (C), EZ (IS/OS) thickness (D), and EZ (IS/OS) peak intensity (E). N = 16 for WT and N = 14 for rd10. *P < 0.05; ***P < 0.001. (A, B, D: paired t-test; C, E: unpaired t-test).

