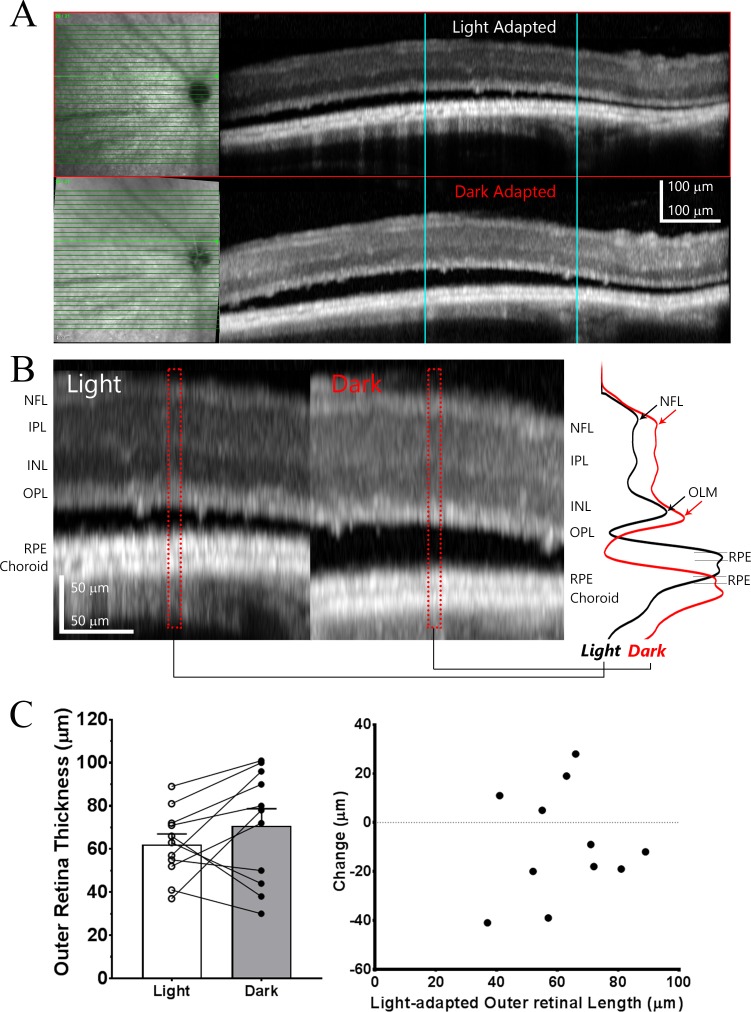
Figure 5.
Light-adaptation has no effect on subretinal fluid in stage III rd10 mice. (A) Example of OCT images obtained from the same P45 rd10 mouse eye under light-adapted and “follow-up” exam after overnight dark-adaptation. Infrared fundus images are shown on the left side of the panel. (B) Magnified OCT images for the same local retina region (outlined by blue lines in [A]) for side-by-side comparison. Intensity profiles of region outlined by dash red box are shown on the right-side panel. (C) Bar graph illustrates averaged outer retinal thickness under light and dark-adapted conditions (n = 11). (D) Relationship of outer retina thickness changes and outer retinal length observed under light-adapted condition.

