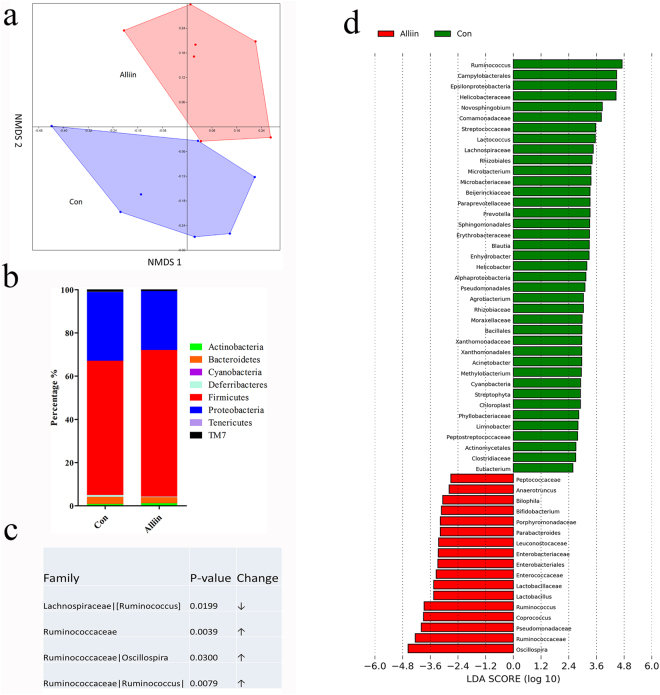
Figure 5.
Analysis of intestinal microbiota. (a) NMD plots showed a significant difference in intestinal taxonomic composition between the alliin treated mice and the control. (b) In general, alliin increased the dominant bacteria of Actinobacteria and Firmicutes but decreased Bacteroidetes and Proteobacteria (no statistical difference). (c) Four groups of bacteria with significant differences were selected as in a table. (averaged reads over 100 and the percentage in its phylum over 1%). (d) Detailed abundance change was shown here. Red indicated that this taxon was more prevalent in the alliin group, while green indicated the taxon was more prevalent in the control group. Data are means ± SEM (n = 7).

