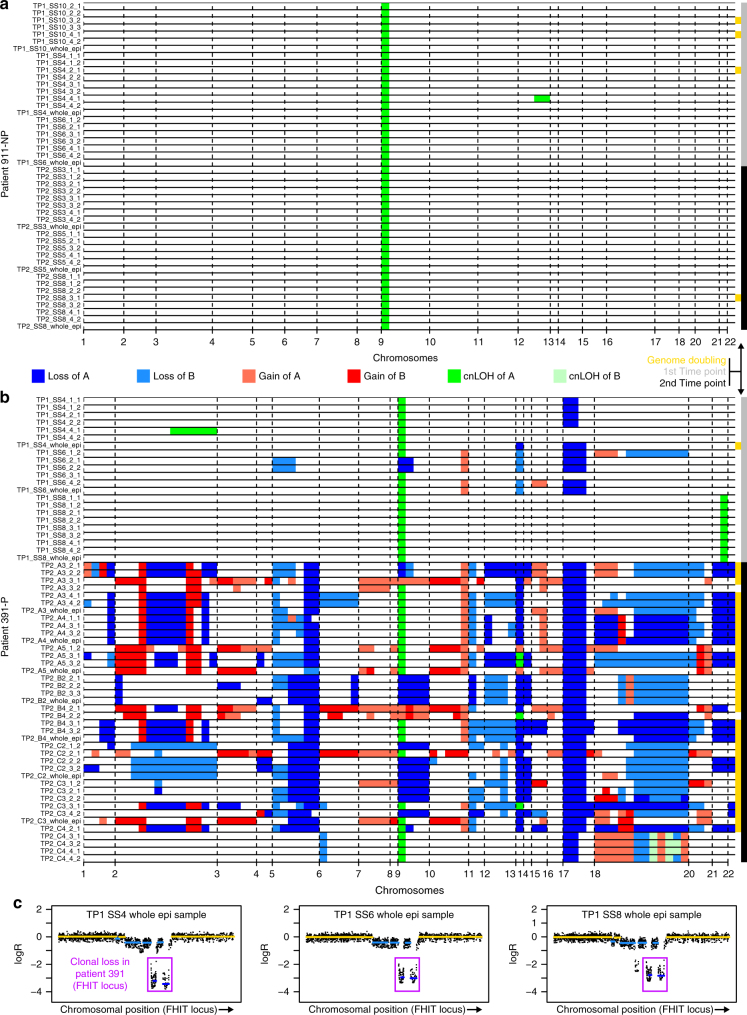
Fig. 2.
Copy number profiles. a, b Scale-free segmented maps. The copy number state of each segment is represented by equal sized bars in each sample. Yellow bars on the right side indicate whether a segment underwent genome doubling. Grey bars on the right indicate samples from the first time point, black bars those from the second time point. a Non-progressor patient 911-NP with 79.3 months between time points. b Progressor patient 391-P with 75.1 months between time points. c A double deletion pattern was observed at the FHIT locus across all samples from patient 391-P. Each dot in a plot is the logR value for a probe on the array and is located at the related chromosomal position on the X axis. Yellow segments indicate a normal copy number, light blue ones a single copy loss and dark blue ones a double loss. Only three samples are shown for illustration

