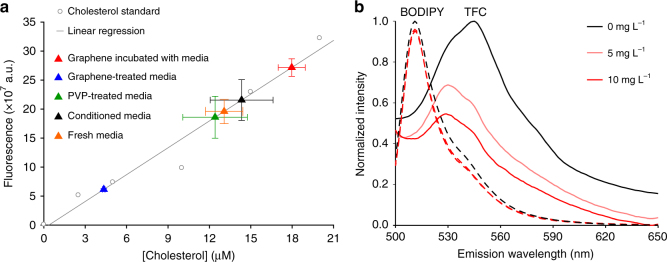
Fig. 1.
Graphene interacts with cholesterol. a Cholesterol concentrations (based on the working curve generated from cholesterol standards, gray circles and line) in fresh serum-containing (orange triangle), untreated (black triangle), PVP-treated (green triangle), graphene-treated media (blue triangle), and graphene incubated with media (red triangle). n = 4 samples per batch, N = 4 total batches. Error bars are S.E.M. b Spectrofluorometer measurements of BODIPY (dashed line) and TFC (solid line) emission after 1-h incubation with graphene (light or dark red), adjusted for the concentration-dependent broadband absorbance of graphene (Supplementary Figure 1) and normalized to the maximum value of 0 mg L-1 graphene and minimum value of 10 mg L-1 graphene at each measured wavelength for both dyes

