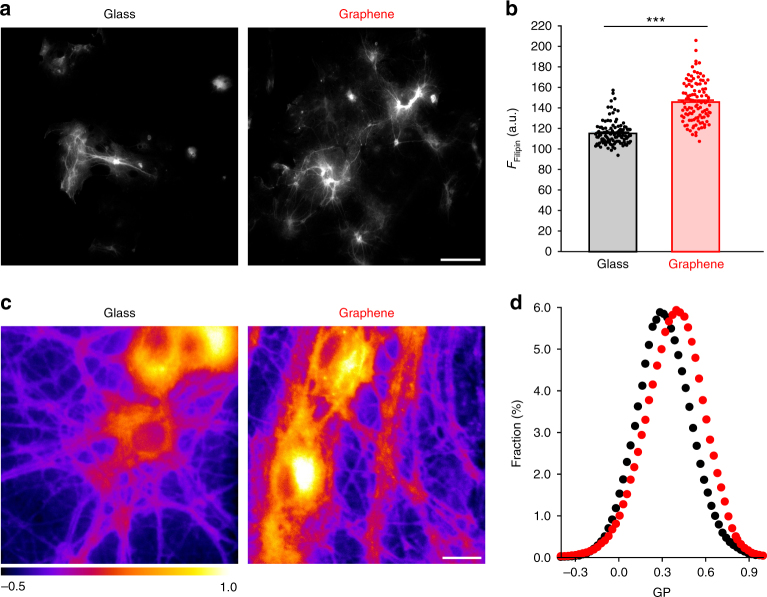
Fig. 3.
Graphene increases cell membrane cholesterol. a Sample images of Filipin staining. Scale bar, 100 μm. b Filipin fluorescence intensity in neuronal neurites (nglass = 118 and ngraphene = 112 neurites, N = 3 batches, ***p < 0.001, Wilcoxin rank-sum test, Cohen’s d = 1.89). c Sample generalized polarization (GP) images. Scale bar, 20 μm. d Distributions of GP values over individual image pixels (n = 7 FOVs, N = 3 batches; p < 0.05, Kolmogorov–Smirnov test of the distributions of GP values, see 'Statistical analysis' section in Methods). Error bars are S.E.M.

