Fig. 7.
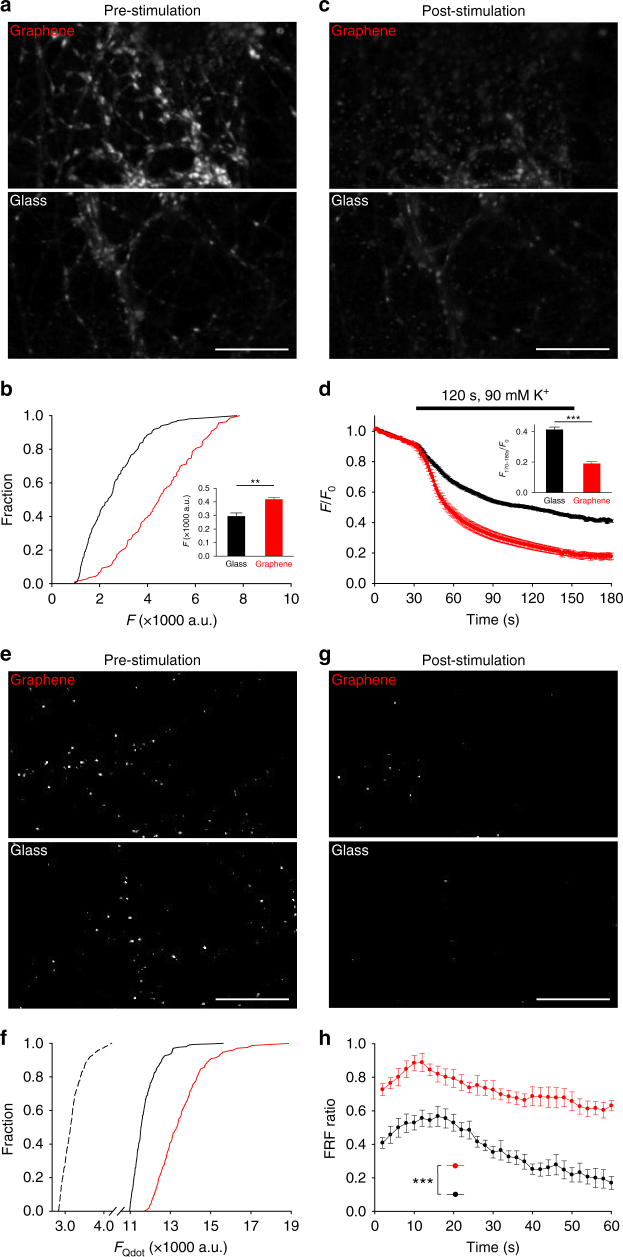
Graphene induces presynaptic potentiation. a Sample images of FM1-43 labeling. Scale bar, 30 μm. b Cumulative distributions of FM1-43 intensities at synaptic boutons (black, glass; red, graphene, same color coding hereafter). nglass = 207 ROIs, ngraphene = 139 ROIs, N = 3; p < 0.05, Kolmogorov–Smirnov test). Inset. Average FM1-43 fluorescence. **p < 0.01, two-tailed t-test. c Sample images of FM1-43 labeling after destaining. Scale bar, 30 μm. d FM1-43 fluorescence during destaining. Inset is average fluorescence from 170 to 180 s (nglass = 207 ROIs, ngraphene = 139 ROIs, N = 3; ***p < 0.001, two-tailed t-test). e Sample images of single Qdot loading. Scale bar, 30 μm. f Cumulative distributions of Qdot intensity after background subtraction in ROIs defined by retrospective FM4-64 labeling (single Qdot loading, dotted line; total recycling pool loading, solid lines). The average single Qdot intensity after background subtraction is 378 ± 41 a.u. The average total Qdot intensities after background subtraction are 8787 ± 156 a.u. for glass and 11,050 ± 224 a.u. for graphene (nglass = 187 ROIs, ngraphene = 211 ROIs, N = 4; p < 0.001, Kolmogorov–Smirnov test). The estimated average numbers of total recycling vesicles are 23.2 for glass and 29.2 for graphene. g Sample images of single Qdot labeling after stimulation. Scale bar, 30 μm. h Fast-and-reversible fusion (FRF) ratio (out of all fusion events) during 1-min 10-Hz field stimulation (nglass = 174 ROIs, ngraphene = 181 ROIs, N = 3; ***p < 0.001, two-tailed t-test on the average FRF values from a five-frame window at the end of each time course). Error bars are S.E.M.

