Figure 3.
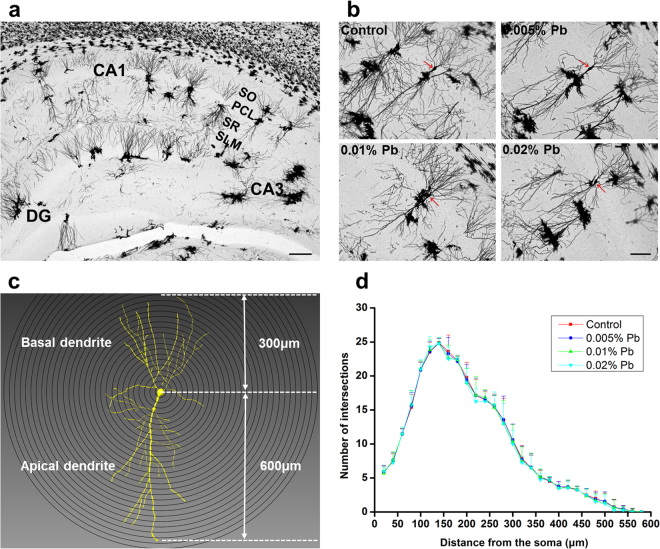
Dendritic morphology quantified with 3D reconstructions of Golgi impregnated neurons and software-assisted tracing of entire dendritic arbors of stained neurons. (a) Golgi Staining of rat hippocampus. stratum oriens, SO; pyramidal cell layer, PCL; stratum radiatum, SR; stratum lacunosum-moleculare, SL-M; dentate gyrus, DG; scale bars = 200 μm. (b) Golgi staining of CA1 pyramidal neurons, scale bars = 100 μm. (c) Imaris reconstruction of CA1 pyramidal neurons (16 neurons/8 rats for all groups). (d) Sholl analysis was applied to measure the dendritic complicity of reconstructed pyramidal neurons, which showed no differences in the numbers of intersections for all groups of GLE Pb-treated rodents. Data are expressed as mean ± SD.

