Figure 2:
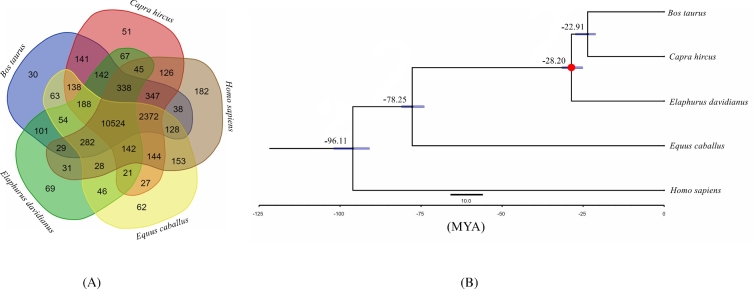
Phylogenetic relationships and genomic comparisons. (A) A Venn diagram of the orthologues shared among Elaphurus davidianus, Equus caballus, Capra hircus, Bos taurus, and Homo sapiens. Each number represents a gene family number, and the sum of the numbers in the green, yellow, brown, red, and blue areas indicate total numbers of the gene families in milu, horse, human, goat, and cattle genomes, respectively. (B) Divergence time estimates for the 5 species generated using MCMCtree and the 4-fold degenerate sites; the dots correspond to calibration points, and the divergence times were obtained from http://www.timetree.org/; blue nodal bars indicate 95% confidence intervals.

