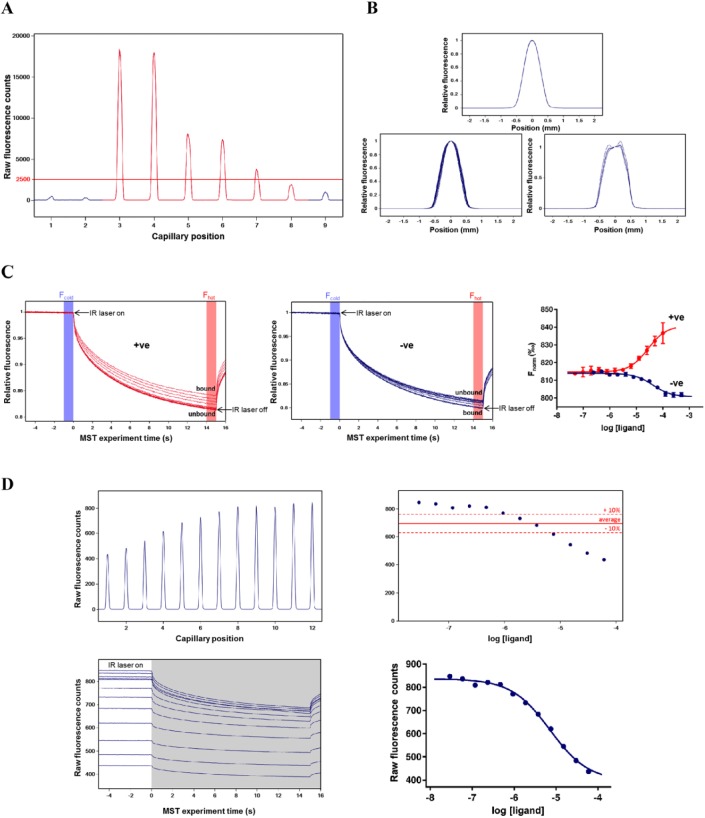
Figure 3.
Representative data collected during MST assay development. (A) UV fluorescence capillary scan for label-free pretest with 500 nM (capillaries 3 and 4), 250 nM (capillaries 5 and 6), and 100 nM (capillaries 7 and 8) target protein. Protein storage buffer (capillary 2) and a high concentration of reference ligand (capillary 9) are also tested for fluorescence and compared with distilled water (capillary 1). (B) With no protein adsorption onto the capillaries, all capillary shape graphs overlay perfectly (top panel). Wide peaks and a lack of superimposition of the capillary shape graphs indicate unspecific protein adsorption to capillary walls (bottom left panel). Very strong adsorption of samples to the capillaries is characterized by a wide double peak (bottom right panel). (C) Typical MST traces for a compound showing positive thermophoresis (left panel) and a compound showing negative thermophoresis (middle panel). Compounds were titrated using a twofold dilution series starting at 500 µM (compound in blue) and 60 µM (compound in red), with 15 nM lysine-labeled target protein in buffer as recommended by NanoTemper (50 mM Tris-HCl [pH 7.4], 150 mM NaCl, and 10 mM MgCl2 + 0.05% Tween 20) using standard capillaries. Measurements were performed using the nanodetector with 40% LED excitation power, 40% MST power, and 5 s MST on-time. Normalized binding response (Fnorm) of compounds showing positive (red) and negative (blue) amplitudes (right panel). (D) Capillary scan showing compound-induced changes in protein fluorescence (top left panel). Example of a compound causing a concentration-dependent variation in fluorescence greater than 10% across a series of capillaries (top right panel). MST traces showing a compound causing a decrease in baseline fluorescence (bottom left panel in white). In such an occurrence, the baseline data should be used rather than the T jump and/or thermophoresis data (shown in grey) to assess compound binding (bottom right panel).

