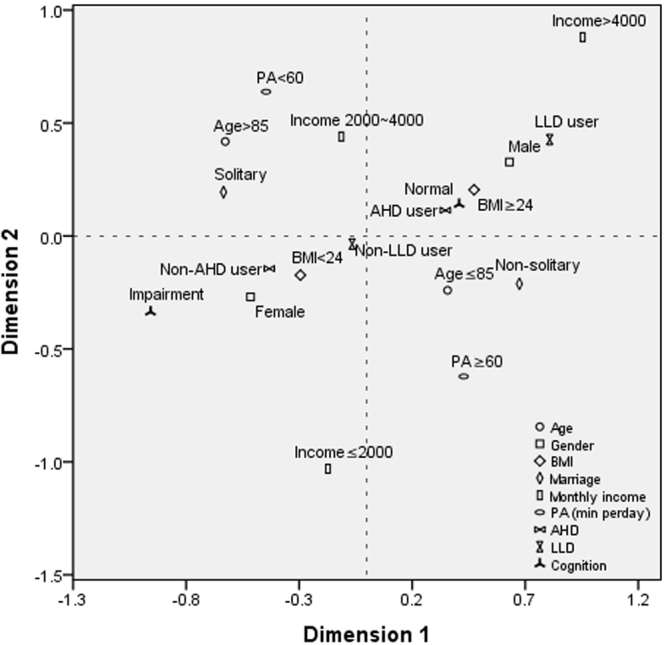
Figure 2.

Multiple correspondence analysis (MCA) plot. Risk factors were presented as icons and a brief description was labeled near the icon indicating a specific category of risk factors. To interpret MCA plot, icons closed together in the same quadrants along the similar direction from centroid would be indicative of possible associations. BMI, body mass index; PA, physical activity; AHD, antihypertensive drugs; LLD, lipid lowering drugs.
