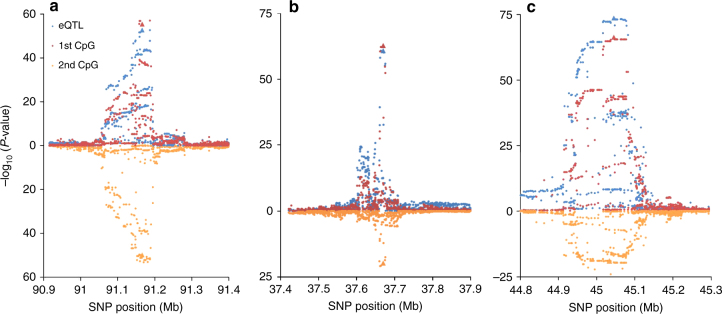
Fig. 7.
Examples of eQTLs that co-localize with a meQTL that has opposite effects on two nearby CpG sites. Results for the CpG selected for co-localization analysis (red) are shown on the top of each plot (ascending), overlaid with the eQTL results (blue). For these scenarios, the expression-increasing allele is associated with increased methylation at a "primary" CpG. Results for a “secondary CpG” are shown below (descending) in orange, for which the expression-increasing allele is associated with decreased methylation. The lead eSNP is shown as a triangle. a eSNP: 10:91186842, gene expression probe: ILMN_1696654, first CpG: cg27582166, second CpG: cg13172359. b eSNP: 6:37669641, gene expression probe: ILMN_1720595, first CpG: cg26720545, second CpG: cg26129310. c eSNP: 3:45047987, gene expression probe: ILMN_2055477, first CpG: cg25593573, second CpG: cg06117855

