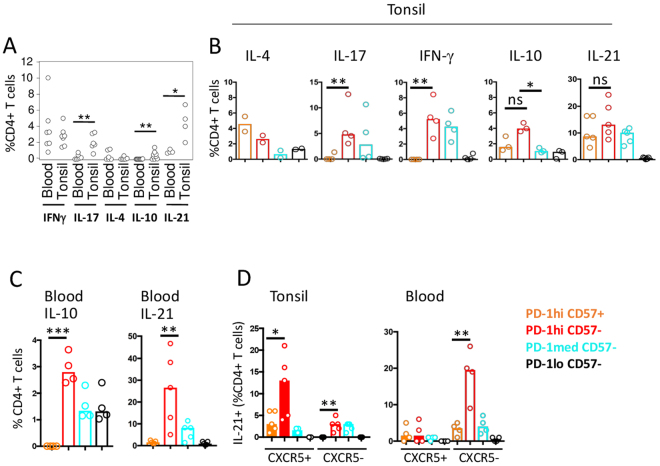
Figure 2.
Cytokine production according to PD-1 and CD57 expression. (A) Summary of relative abundance of CD4+ T cells expressing the indicated cytokines in tonsil and blood, determined by intracellular staining and flow cytometry of paired samples from individual donors (n = 7, except for IL-21 where n = 4). (B) Summary of relative abundance of intracellular cytokines in purified CD4+ T cell subsets defined in Fig. 1H. Each symbol indicates a result from a different donor (IL-4, n = 2; IL-17, n = 4; IFN-γ, n = 4; IL-10, n = 3; IL-21, n = 5). (C) Summary of relative abundance of IL-21 (n = 5) and IL-10 (n = 4) positive cells in peripheral blood subsets. (D) Summary of abundance of IL-21 producing cells in each indicated CD4+ T cell subset from tonsil (n = 5) or blood (n = 4), analysed according to CXCR5 expression. *p < 0.05; **p < 0.01, ***p < 0.001.

