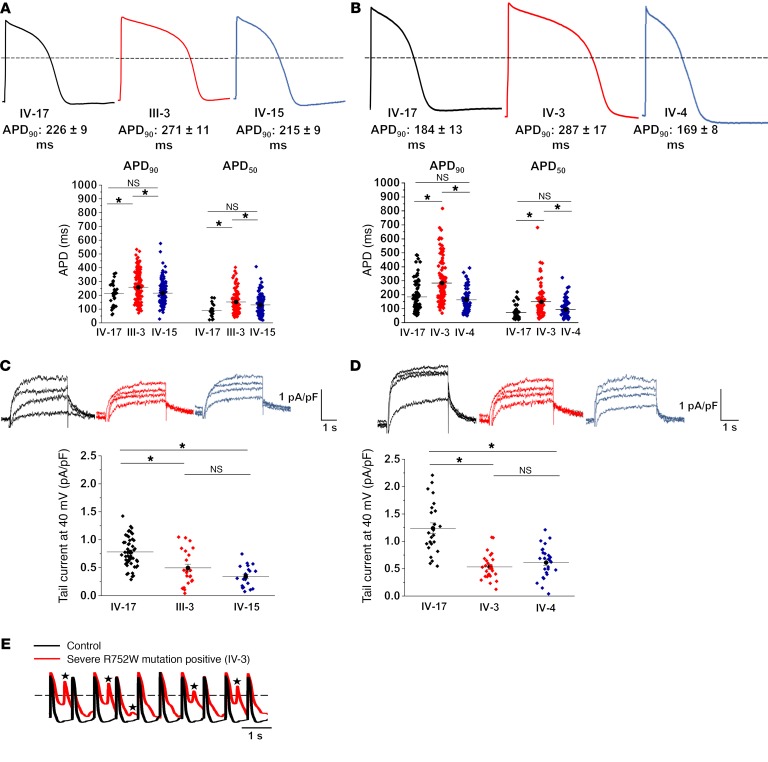
Figure 2. LQT2 genotype-phenotype discordance reproduced in patient-specific iPSC-CMs.
(A) Representative action potential traces from the control (IV-7), a severely-affected-phenotype LQT2 male (III-3), and his son, a hERG R752W mutant–positive, mildly-affected-phenotype male (IV-15). Summary APD90 (90% of repolarization) and APD50 (50% of repolarization) data are also shown (below traces). (B) Representative action potential traces from the control (IV-17) and the second pair (sister pair), a severely affected LQT2 female (IV-3) and a hERG R752W mutant–positive, mildly affected female (IV-4). Summary APD90 and APD50 data are shown (below traces). (C) Representative IKr traces and respective summary IKr tail current density from each patient-derived iPSC-CM depicted in A. (D) Representative IKr traces and respective summary IKr tail current density for each patient-derived iPSC-CM depicted in B. (E) A 1-Hz paced action potential train from IV-17 and IV-3 iPSC-CMs. Stars denote early afterdepolarizations. Dashed line in APD traces denotes 0 mV. Between 30 and 203 cells from 9 different iPSC clones (3 each from IV-17, III-3, IV-15 paired trio) were analyzed in A and C. Between 77 and 134 cells from 9 different iPSC clones (3 each from IV-17, IV-3, IV-4 paired trio) were analyzed in B and D. Exact numbers of replicate measures (n) for each are listed in Supplemental Table 3. Results are shown as mean ± SEM. *Statistical significance (P < 0.05) as determined by ANOVA in the summary data for A–D.

