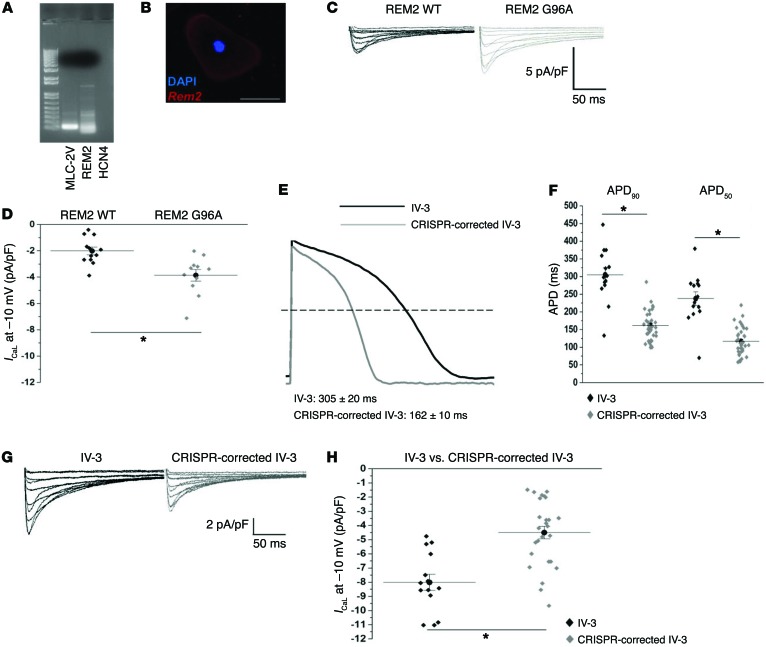
Figure 7. REM2 variant found in severely affected individuals drives significant increase in ICaL, but is reverted back to WT levels with CRISPR/Cas9–mediated gene correction.
(A) Single-cell RT-PCR confirmation of REM2 expression and ventricular lineage in electrophysiology-verified ventricular patient iPSC-CMs (IV-3–derived cell shown here). MLC-2v, myosin light chain 2 ventricle (ventricular lineage marker); HCN4, hyperpolarization-activated cyclic nucleotide-gated potassium channel 4 (pacemaker lineage marker). (B) Immunohistochemical confirmation of REM2 expression in an iCell ventricular cardiomyocyte. Blue, nucleus; red, REM2. Scale bar: 50 μm. (C) Macroscopic L-type Ca2+ currents obtained from iCell ventricular cardiomyocytes transfected with either REM2 wild type or REM2 G96A (mimicking the SNP found in severely affected hERG R752W mutation–positive individuals, III-3 and IV-3). (D) Summary data of REM2 WT overexpression (2 μg cDNA) in iCell ventricular cardiomyocytes compared with REM2 G96A. REM2 WT and REM2 G96A are composed of 3 independent experiments (REM2 WT n = 12, REM2 G96A n = 11). Relative current for REM2 WT at 0 mV, –2.21 ± –0.34, compared with REM2 G96A, –3.60 ± –0.39. *P = 0.002 as determined by unpaired Student’s t test. (E) The effects of CRISPR/Cas9–mediated correction of the REM2 G96A mutant allele back to the wild type (from A96 to G96) on APD90 (macroscopic action potential record shown). (F) Summary APD90 and APD50 data from IV-3 compared with CRISPR-corrected IV-3. (G) Macroscopic raw traces of L-type calcium current comparing IV-3 against CRISPR-corrected IV-3. (H) Summary L-type calcium current data comparing IV-3 against CRISPR-corrected IV-3. See Supplemental Table 8 for exact numbers of replicate measures (n) and statistical analysis. Three separate CRISPR/Cas9–corrected differentiations were characterized for data shown in E–H. *Statistical significance (P < 0.05) as determined by unpaired Student’s t test in F and H.

