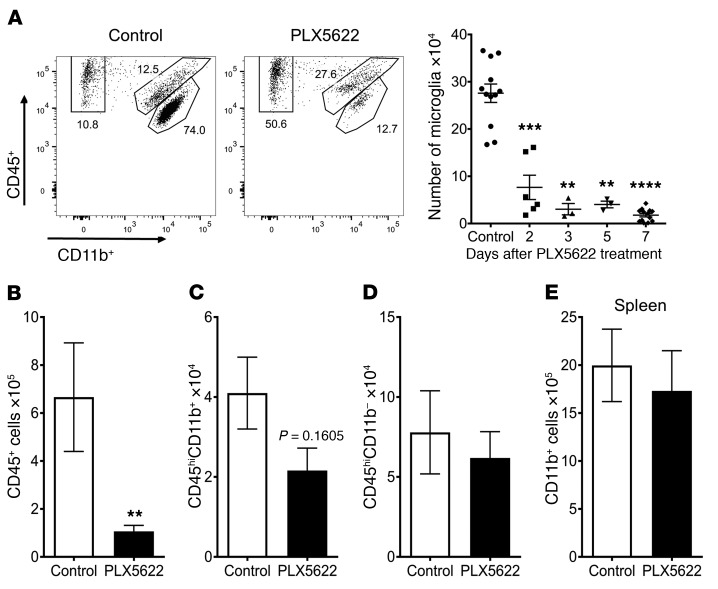
Figure 2. PLX5622 treatment specifically depletes microglia.
After PLX5622 treatment, flow cytometry was used to analyze cells from brain (A–D) and spleen (E). (A) Representative flow plot gated on CD45+ cells shows gating for microglia (CD45intCD11b+), macrophages (CD45hiCD11b+), and lymphocytes (CD45+CD11b–). Graph shows a summary of the number of microglia isolated per brain at the indicated time points after initiation of PLX5622 treatment. Number of total CD45+ cells (B), macrophages (C), and lymphocytes (D) found in the brain after 7 days of PLX5622 treatment. Number of CD11b+ cells (E) within the spleen after 7 days of PLX5622 treatment. Data in B–E represent combined results from 3 independent experiments, with a combined total of 8 mice per group. Statistical significance was determined using Mann-Whitney U tests. **P < 0.01, ***P < 0.001, and ****P < 0.0001.

