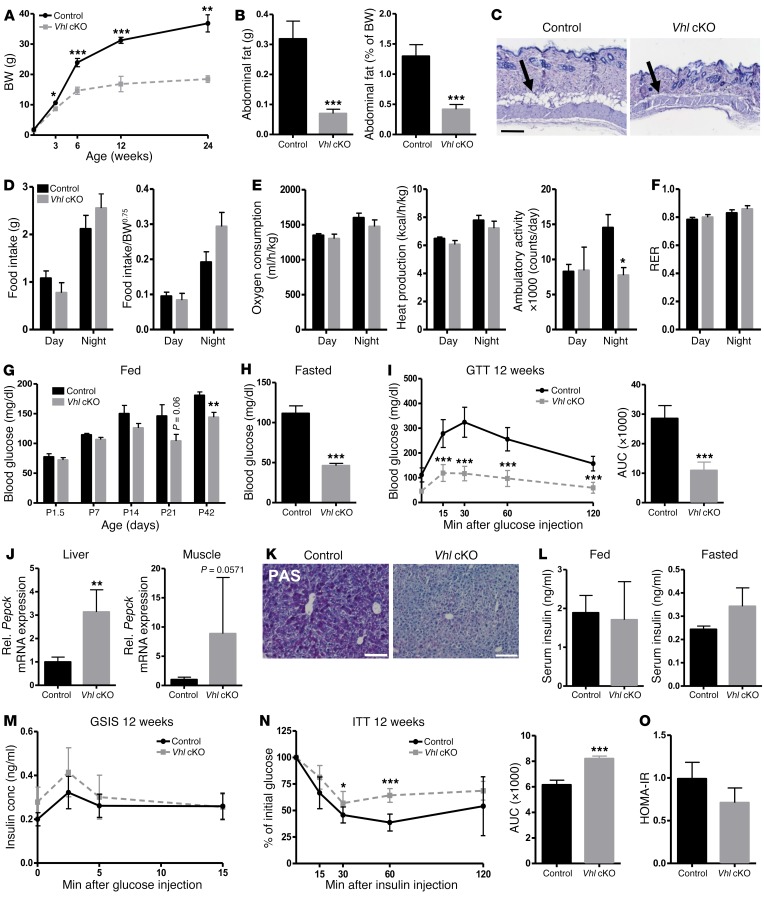
Figure 3. Osteoprogenitor-targeted Vhl cKO mice are lean, despite normal food intake and reduced physical activity, and display a hypoglycemic phenotype with increased systemic glucose tolerance.
(A) BW of control and constitutive Vhl cKO mice at the indicated ages (n = 3–10/group). (B) Abdominal fat mass as absolute values, in grams (left), and relative as percentage of BW (right) (n = 10–14) in 12-week-old male mice. (C) Representative H&E-stained skin sections. Scale bar: 100 μm. Arrows point to subcutaneous fat. (D) Food intake over 2 days/nights, in absolute values (left) and corrected for the metabolic BW (BW0.75, BW raised to the three-quarter power, as commonly used to normalize energy metabolism data) (right) (n = 6–7). (E) Indirect calorimetry measurements of oxygen consumption, heat production, and ambulatory activity, corrected for BW0.75 (n = 6–7). (F) RER (n = 6–7). (G) Blood glucose levels in random-fed state from P1.5 to P42 (n = 6–8/group). (H) Blood glucose levels after overnight fasting at 12 weeks (n = 7–9). (I) GTT and its quantification as AUC (n = 7–9). (J) Pepck mRNA levels in liver and muscle (n = 4). (K) PAS staining on liver, revealing glycogen content (n = 4). Scale bar: 100 μm. (L) Serum insulin levels in random-fed (left) and fasted (right) conditions (n = 4–9). (M) GSIS (n = 9). conc, concentration. (N) ITT and AUC quantification (n = 6–9). (O) HOMA-IR (n = 9). All analyses were performed on male control and constitutive Vhl cKO mice at 12 weeks of age, unless indicated otherwise. Graphs represent mean ± SEM, and *P < 0.05, **P < 0.01, ***P < 0.001 by Student’s t test between genotypes, unless indicated otherwise.

