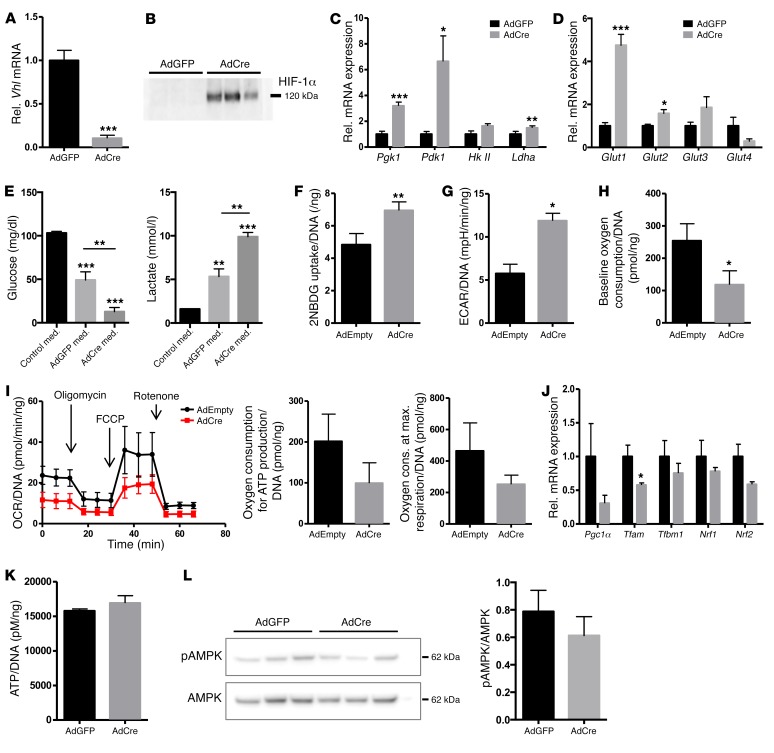
Figure 6. Vhl-deficient osteoblasts show increased glucose uptake and glycolysis.
(A) Relative mRNA expression levels of Vhl in cultured primary osteoblasts derived from Vhlfl/fl mice and transduced with adenoviruses expressing GFP (AdGFP) or Cre (AdCre) (n = 5 paired independent cell pools). (B) Western blot for HIF-1α confirming its effective stabilization in Vhl-deficient cells (AdCre) compared with control cultures (AdGFP) (n = 3). (C and D) mRNA levels of (C) Pgk1, Pdk1, hexokinase 2 (HkII), and Ldha, and (D) Glut1–4 in AdGFP- versus AdCre-transduced Vhlfl/fl osteoblasts (n = 5 cell pools). (E) Glucose (left) and lactate (right) concentration in unconditioned (black bars) and 24-hour-conditioned medium (n = 5–6). med., medium. (F) 2-NBDG uptake in primary osteoblasts (normalized for DNA content of the well, n = 3). (G–I) Extracellular flux analysis of primary osteoblasts (n = 5), showing (G) ECAR, (H) basal oxygen consumption, and (I) OCR during a mitochondrial stress test including the oxygen consumption needed for ATP production and at maximum respiration, all normalized for DNA content. (J) Relative mRNA expression levels of mitochondrial biogenesis genes in control (AdGFP) versus Vhl-deficient (AdCre) cultured osteoblasts (n = 5), showing peroxisome proliferator–activated receptor γ coactivator 1α (Pgc1α), transcription factor A, mitochondrial (Tfam), transcription factor B1, mitochondrial (Tfbm1), nuclear respiratory factor 1 (Nrf1) and 2 (Nrf2). (K) ATP production, normalized for DNA (n = 4). (L) Western blot for phosphorylated and total AMPK, showing representative results of n = 3 paired independent cell pools (AdGFP, AdCre) and quantification of the signal in n = 6 pools. Graphs represent mean ± SEM, and *P < 0.05, **P < 0.01, ***P < 0.001 by Student’s t test between genotypes.

