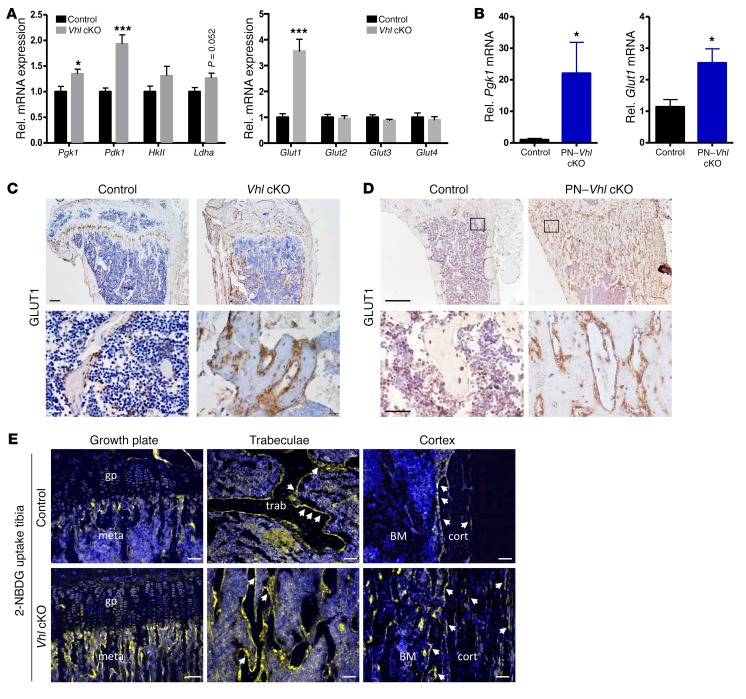
Figure 7. Osteoblast lineage cells are the prime glucose-consuming cells in the skeleton.
(A) Relative mRNA levels of Pgk1, Pdk1, HkII, Ldha (left), and Glut1–4 (right) in bones of 12-week-old control and constitutive Vhl cKO mice (n = 7). (B) mRNA levels of Pgk1 and Glut1 in bones of control and PN–Vhl cKO mice at 24 weeks (n = 6–8). (C and D) GLUT-1 IHC on tibia sections of (C) Vhl cKO mice (scale bars: 200 μm [top] and 25 μm [bottom, magnified views]) and (D) PN–Vhl cKO mice (scale bars: 500 μm [top] and 100 μm [bottom, magnified views]). (E) Visualization of 2-NBDG uptake in tibias harvested 45 minutes after injection; the signal is strongest in the metaphyseal (meta), trabecular (trab), and cortical (cort) bone regions (most evidently localizing in osteolineage cells on and around the bone surfaces [arrows]), and less intense in growth plate (gp) chondrocytes, BM hematopoietic cells, and bone-embedded osteocytes. Scale bars: 50 μm. Data are shown as mean ± SEM; *P < 0.05, ***P < 0.001 by Student’s t test. C–E show representative sections of n = 3 mice analyzed per genotype.

