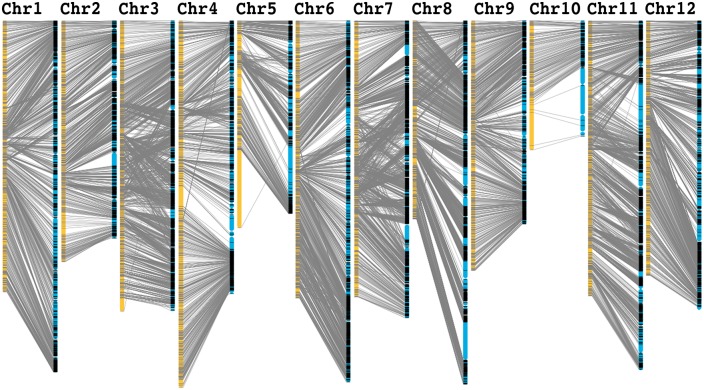
Figure 3.
Re-anchored scaffolds based on the ultra-dense genetic map constructed in this study. Yellow columns represent the 12 pseudo-chromosomes of melon. Bin markers are located according to genetic distance (cM). Scaffolds were displayed in blue and grey lines represent corresponding genetic markers between each pseudo-chromosome and scaffolds.

