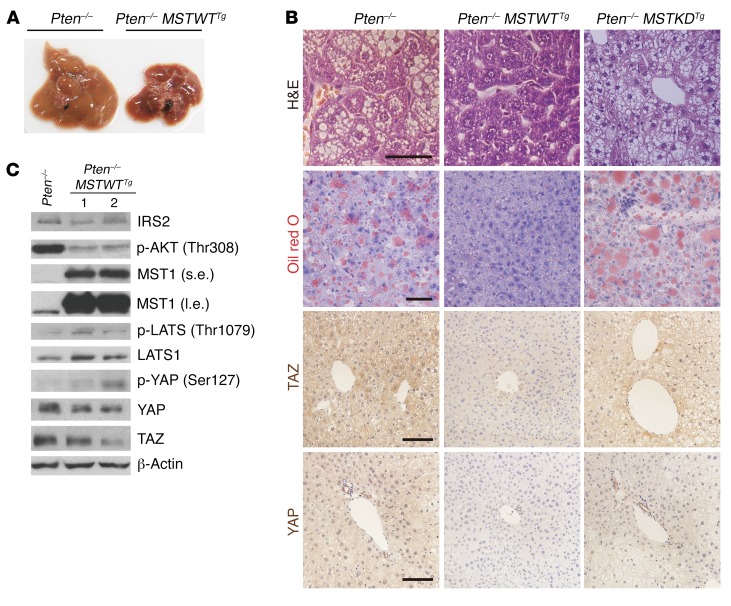
Figure 6. Activation of the Hippo pathway rescues the NAFLD phenotype through suppression of IRS2/AKT signaling.
(A–C) Macroscopic appearance (A), H&E, Oil red O, TAZ, and YAP immunohistochemical staining (B), as well as immunoblot analysis (C) of livers from 2-month-old Pten–/– and Pten–/– MSTWTTg mice (n = 4). Scale bars: 50 μm (top 2 rows) and 100 μm (bottom 2 rows). β-Actin was used as a loading control in C.

