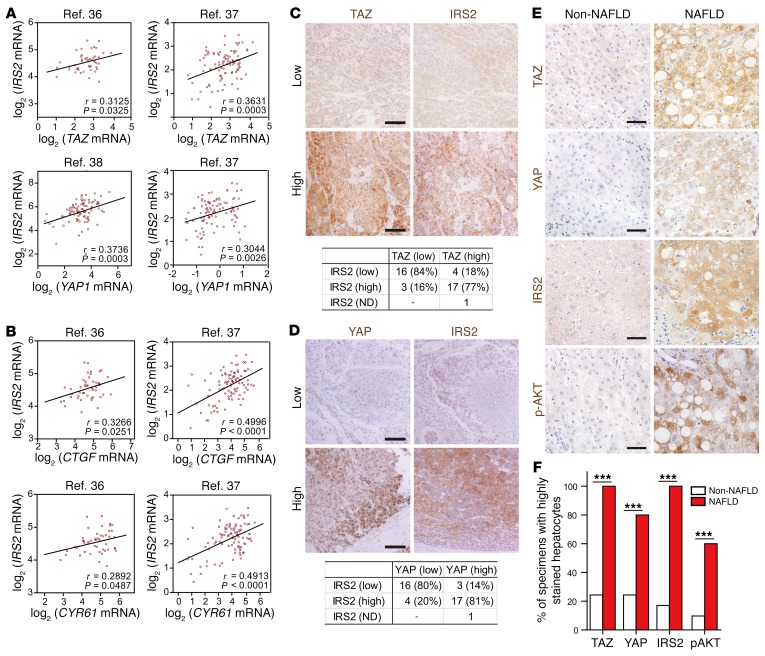
Figure 7. Correlation of TAZ/YAP and IRS2–p-AKT expression in patients with liver cancer.
(A and B) Scatter plots of log2 (mRNA abundance) values for IRS2 versus TAZ or YAP1 (A) and for IRS2 versus CTGF or CYR61 (B) in tissue specimens from patients with liver cancer or cirrhosis (n = 47) (36), HCC (n = 91) (38), or both HCC and cirrhosis (n = 96) (37). These data were obtained from the Oncomine database and were compared with one another by calculation of the Pearson’s r correlation coefficient. (C and D) Representative IHC staining of TAZ and IRS2 (C) or YAP and IRS2 (D) in HCC patients’ specimens and a comparison of their corresponding levels of expression using the χ2 test (P < 0.001 for C and D). Scale bars: 100 μm. (E and F) Representative images of HCC specimens with associated NAFLD that had high TAZ, YAP, IRS2, and p-AKT (Ser473) IHC intensities compared with HCC specimens not associated with NAFLD (Non-NAFLD) (E). Quantification of the percentage of specimens from E and F. ***P < 0.001, by χ2 test. Scale bars: 50 μm. ND, not detected.

