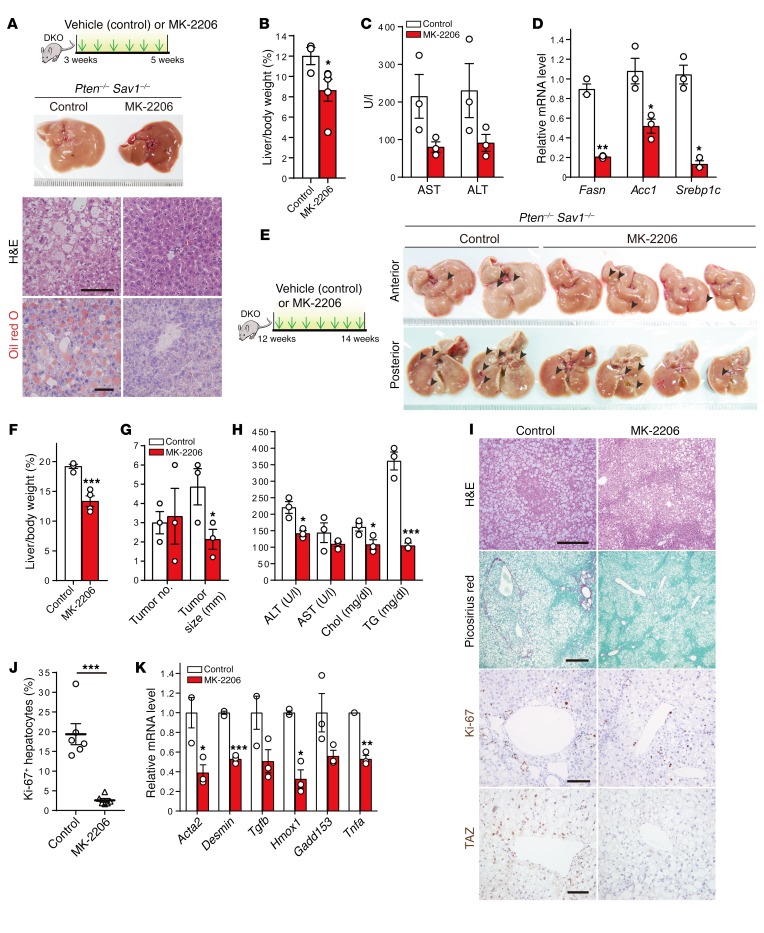
Figure 8. Treatment with the AKT inhibitor MK-2206 attenuates the development of NAFLD and liver tumor progression.
(A–D) Experimental design used to treat 3-week-old DKO mice for 2 weeks with MK-2206 (n = 3 or 5) or vehicle (control, n = 3). Macroscopic appearance of the liver as well as H&E and Oil red O staining (A), liver-to-body weight ratio (B), analysis of liver enzymes in the serum (C), and qPCR analysis of lipogenesis-related gene expression in the liver (D). Scale bars: 50 μm (A). (E–K) Experimental design used to treat 12-week-old DKO mice for 2 weeks with MK-2206 (n = 3 or 4) or vehicle (n = 3). Macroscopic appearance of the liver (E), liver-to–body weight ratio (F), liver tumor number and size (G), serum analysis (H), H&E, Picrosirius red, Ki-67, and TAZ immunohistochemical staining (I), quantification of Ki-67+ hepatocytes (J), and qPCR analysis of the expression of genes related to fibrosis (Acta2, desmin, and Tgfb), cell death or injury (Hmox1 and Gadd153), or inflammation (Tnfa) (K). Arrowheads in E indicate tumor nodules. Scale bars: 300, 400, 100, and 100 μm (I, top to bottom, respectively). Chol, cholesterol; TG, triglycerides. Quantitative data in F–H, J, and K represent the mean ± SEM. *P < 0.05, **P < 0.01, and ***P < 0.001 versus control (Student’s t test).

