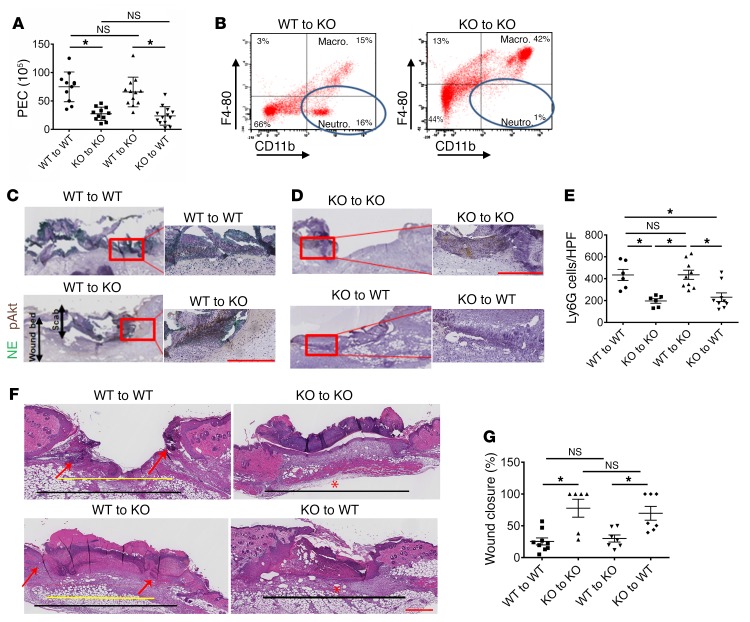
Figure 10. The influence of BM transplantation on inflammation and wound healing.
(A) PEC number after TG-induced peritonitis in WT or KO (F12–/–) hosts after WT or KO BM transplantation (n = 11–13 transplants/condition). Mean ± SEM. *P < 0.0004 by 1-way ANOVA. (B) Flow cytometry of murine peritoneal lavage fluid 4 hours following TG-induced peritonitis in WT or KO BM–transplanted hosts. PEC were labeled with PE-conjugated anti-CD11b and PerCPCy 5.5–conjugated anti–F4-80 antibodies. Circles indicate the neutrophil subpopulation (CD11b-positive, F4-80–negative cells). The figure shows a representative flow cytogram of n = 4 transplanted animals in each group. (C) NE and pAkt coimmunostaining from day 2 wounds of WT and (D) day 2 wounds of F12–/– BM chimeras. Representative images of n = 4 wounds in each group. Left panels in C and D. Scale bars: 50 μm (left panels); 100 μm (right panels). Original magnification, ×4 (left panels); ×20 (right panels). (E) Number of Ly6G cells/high-power field in day 2 wounds of WT and F12–/– chimeras. n = 6–9 transplants/condition. Mean ± SEM. *P < 0.007, 1-way ANOVA. (F) H&E-stained sections in day 5 wounds of WT and F12–/– BM chimeras. Representative images of n = 6–9 wounds in each group of transplanted animals. Original magnification, ×4. Black lines demarcate the total length of original wound; yellow line represents the remaining wound gap. Red arrows represent the ingrowing epithelial tongues, closing wound. In photographs in which a red asterisk is seen, the wound gap is 0, indicating that the wound has completely reepithelialized. Scale bars: 100 μm. Histologic sections were obtained using a Leica SCN 400 slide scanner equipped with a Hamamatsu line sensor color camera. Analysis was performed using ImageJ software. (G) Wound closure in WT and F12–/– BM chimeras, n = 6–9 wounds/group. Mean ± SEM. *P = 0.0004, 1-way ANOVA.

