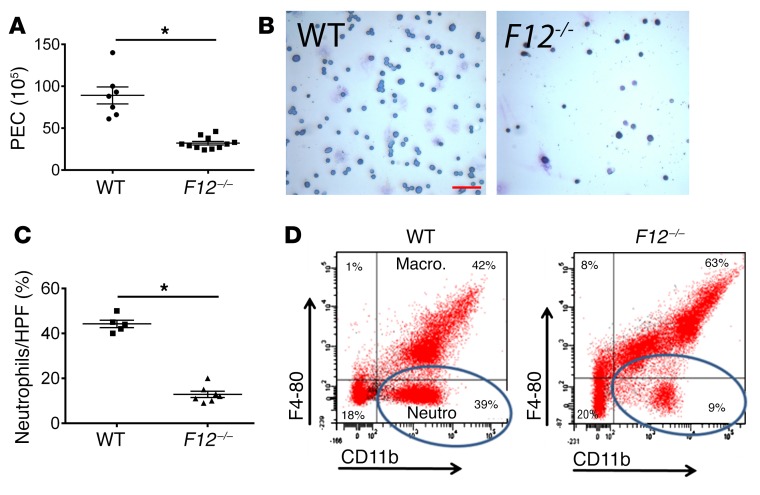
Figure 2. Leukocyte migration in TG-induced peritonitis.
WT and F12–/– mice were injected intraperitoneally with TG solution. At 4 hours (A), mice were subjected to peritoneal lavage and the PEC number was determined. WT, n = 7; F12–/–, n = 11 mice (mean ± SEM). *P = 0.0001 vs. WT control mice by Student’s t test. (B) Giemsa-Wright stain of peritoneal lavage fluid. Original magnification, ×4. Scale bar: 10 μm. Representative images of n = 5 WT and n = 7 F12–/– animals. (C) Quantitation of neutrophil population in the peritoneal lavage fluid of WT and F12–/– mice 4 hours after TG instillation as observed by light microscopy (WT, n = 5; F12–/–, n = 7). Data represent mean ± SEM. *P < 0.0001 vs. WT control mice by Student’s t test. (D) Murine peritoneal lavage fluid was labeled with PE-conjugated anti-CD11b and PerCPCy 5.5–conjugated anti–F4-80 antibodies. Circles indicate the neutrophil subpopulation (CD11b-positive, F4-80–negative cells). These figures are representative of flow cytograms of n = 4 animals in each group.

