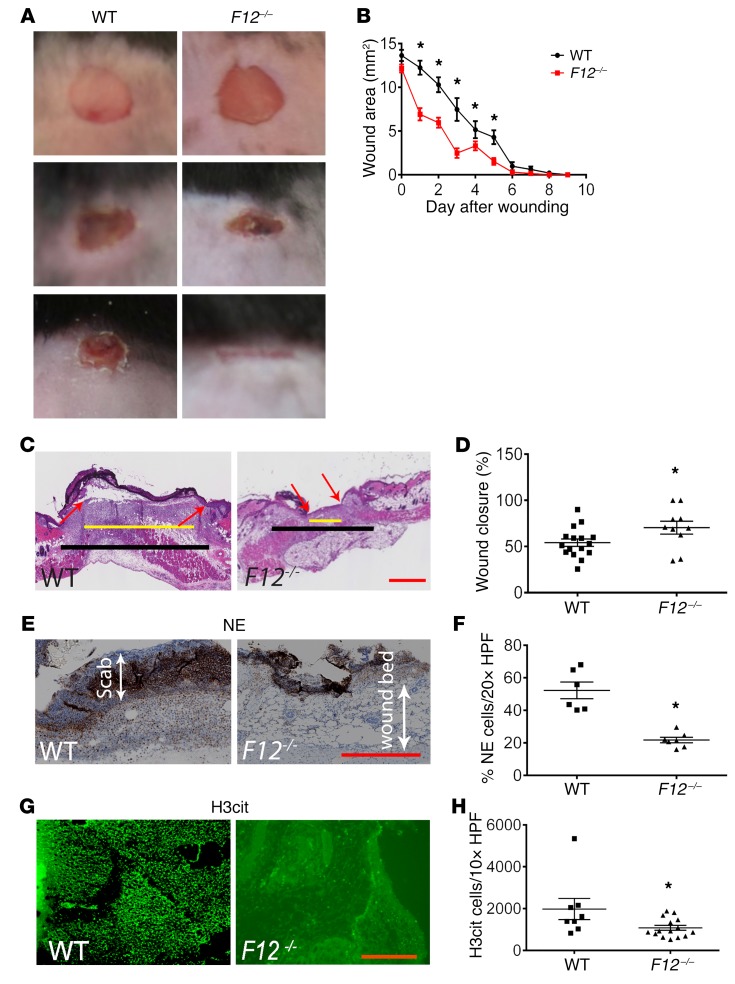
Figure 3. Influence of FXII on wound healing.
(A) Full thickness wounds from WT and F12–/– mice (n = 12 mice/group) were imaged daily until closure using a Nikon SMZ-U dissecting microscope. Original magnification, ×1. (B) The wound area (mm2) was measured daily from day 0 until closure in WT (n = 20) and F12–/– (n = 28) mice. Wounds were considered closed when their areas relative to day 0 were less than 5%. Mean ± SEM. *P < 0.05, 2-way ANOVA. (C) H&E-stained sections from day 5 were analyzed to determine the degree of reepithelialization. Black line demarcates the total length of wound space; yellow line represents the remaining wound gap. Red arrows indicate the epithelial tongues showing ingrowing epithelium. All histologic sections were obtained using a Leica SCN 400 slide scanner equipped with a Hamamatsu line sensor color camera at ×4 magnification. Scale bar: 100 μm. (D) The percentage of reepithelialization (% wound closure) was determined using the ImageJ software and is shown for WT (n = 16) and F12–/– (n = 10) mice. Mean ± SEM. *P < 0.05, Student’s t test. (E and G) Sections from day 2 wounds were stained for NE (E) at ×20 magnification or H3Cit (G) at ×10 magnification, respectively. Scale bars: 50 μm (E); 20 μm (G). (F) NE content was determined in the wound bed immediately beneath the scab in day 2 wounds and presented as percentage of NE-stained cells to total number of cells per high-power field. WT, n = 6; F12–/–, n = 7. Mean ± SEM. *P = 0.001, Student’s t test. (H) H3Cit content of day 2 wounds is presented as total number of cells per high-power field. WT, n = 8; F12–/–, n = 15. Mean ± SEM. *P < 0.04, Student’s t test.

